|
Getting your Trinity Audio player ready...
|
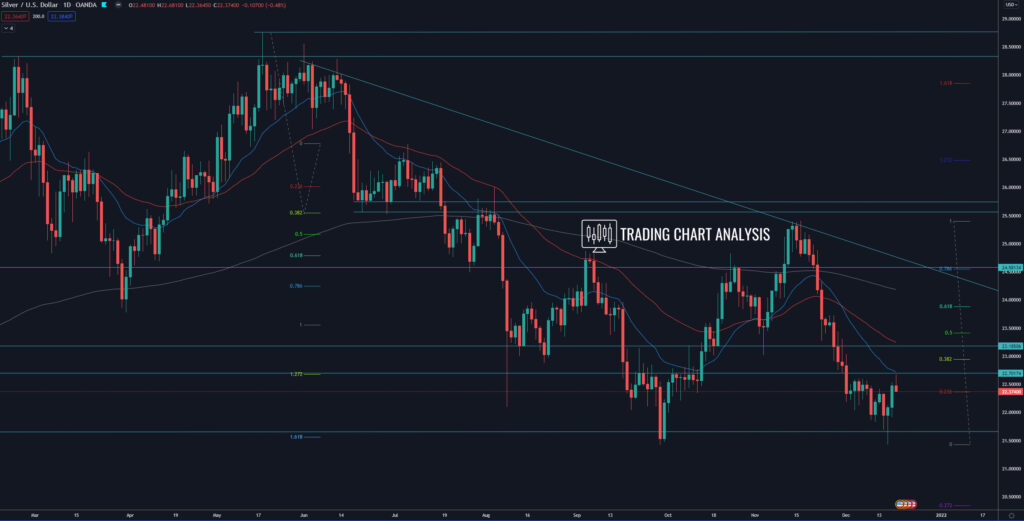
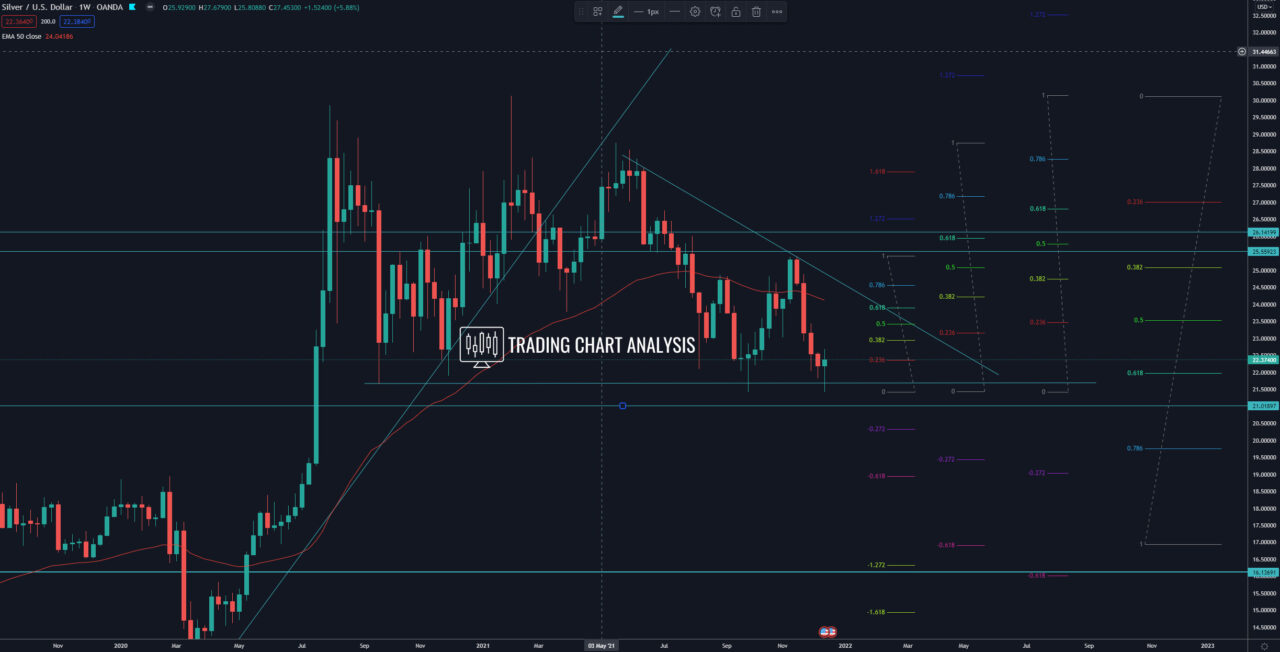
Technical analysis for XAG/USD, the price of Silver formed a double bottom on the weekly and the daily charts. The price of XAG/USD held support and 0.618 FIB retracement and bounced from it, starting a pullback. The first target of this pullback is the 0.382 FIB retracement at 22.95. The second target is the 0.618 FIB retracement at 23.90. And if the price breaks above the descending trend line and 0.618 FIB retracement, that will open the door for a bullish run toward the previous high at 25.40.
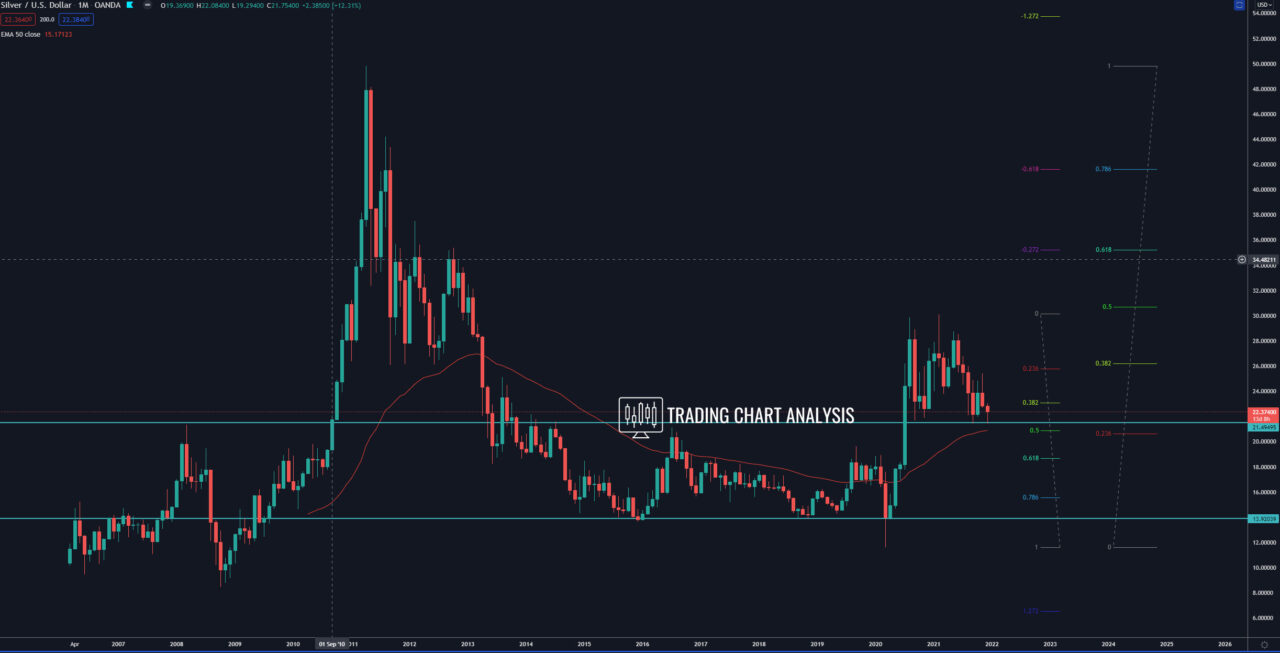
On the other hand, if the price of Silver breaks below the double bottom at 21.42, it will have bearish implications for the price of XAG/USD. The first target for such a potential breakout is the 0,618 FIB retracement on the monthly chart at 18.70.
Daily chart:

Weekly chart:

Monthly chart:


