|
Getting your Trinity Audio player ready...
|
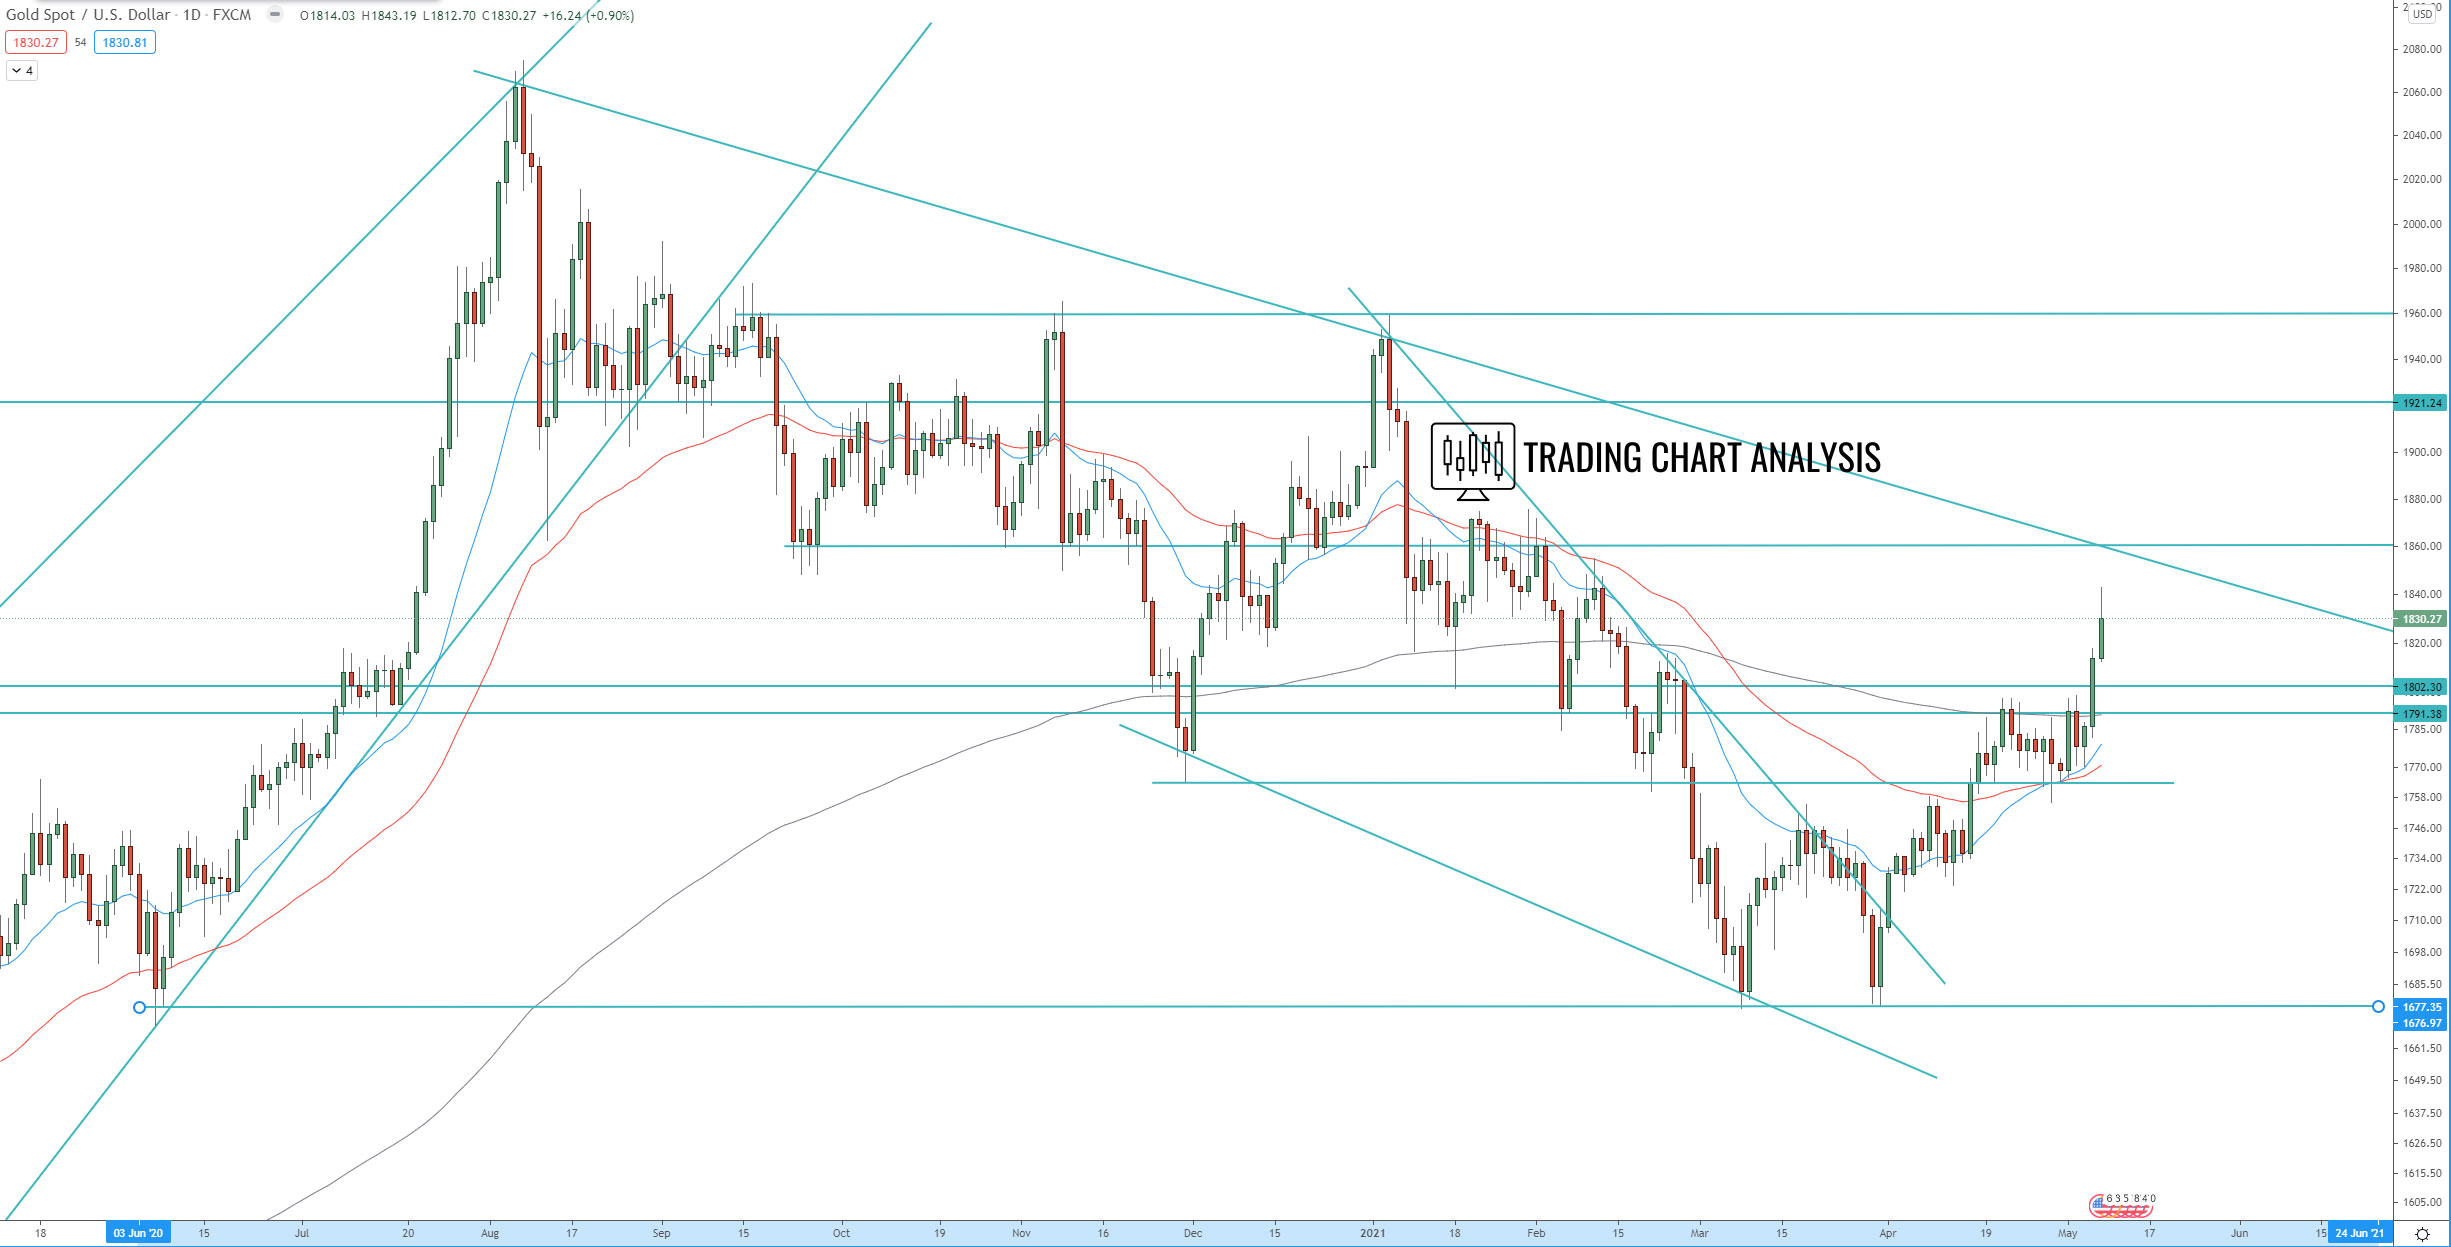
Technical analysis for Gold (XAU/USD), the price broke above the double tops and resistance zone between 1790-1805 on the daily chart. The first target of this breakout is at 1.272 FIB extension at 1910$, the second target is at 1.618 FIB extension at 1950, and the third target is at the previous high at 2074$. The focus now is on the resistance between 1855-1875, break above that resistance will clear the way for a run toward 1950$.
Key support zones for the Gold (XAU/USD) are between 1790-1805, and 1765-1755. If the price of Gold (XAU/USD) breaks below 1755$, it will send the price lower and invalidate the current bullish outlook.
Daily chart:
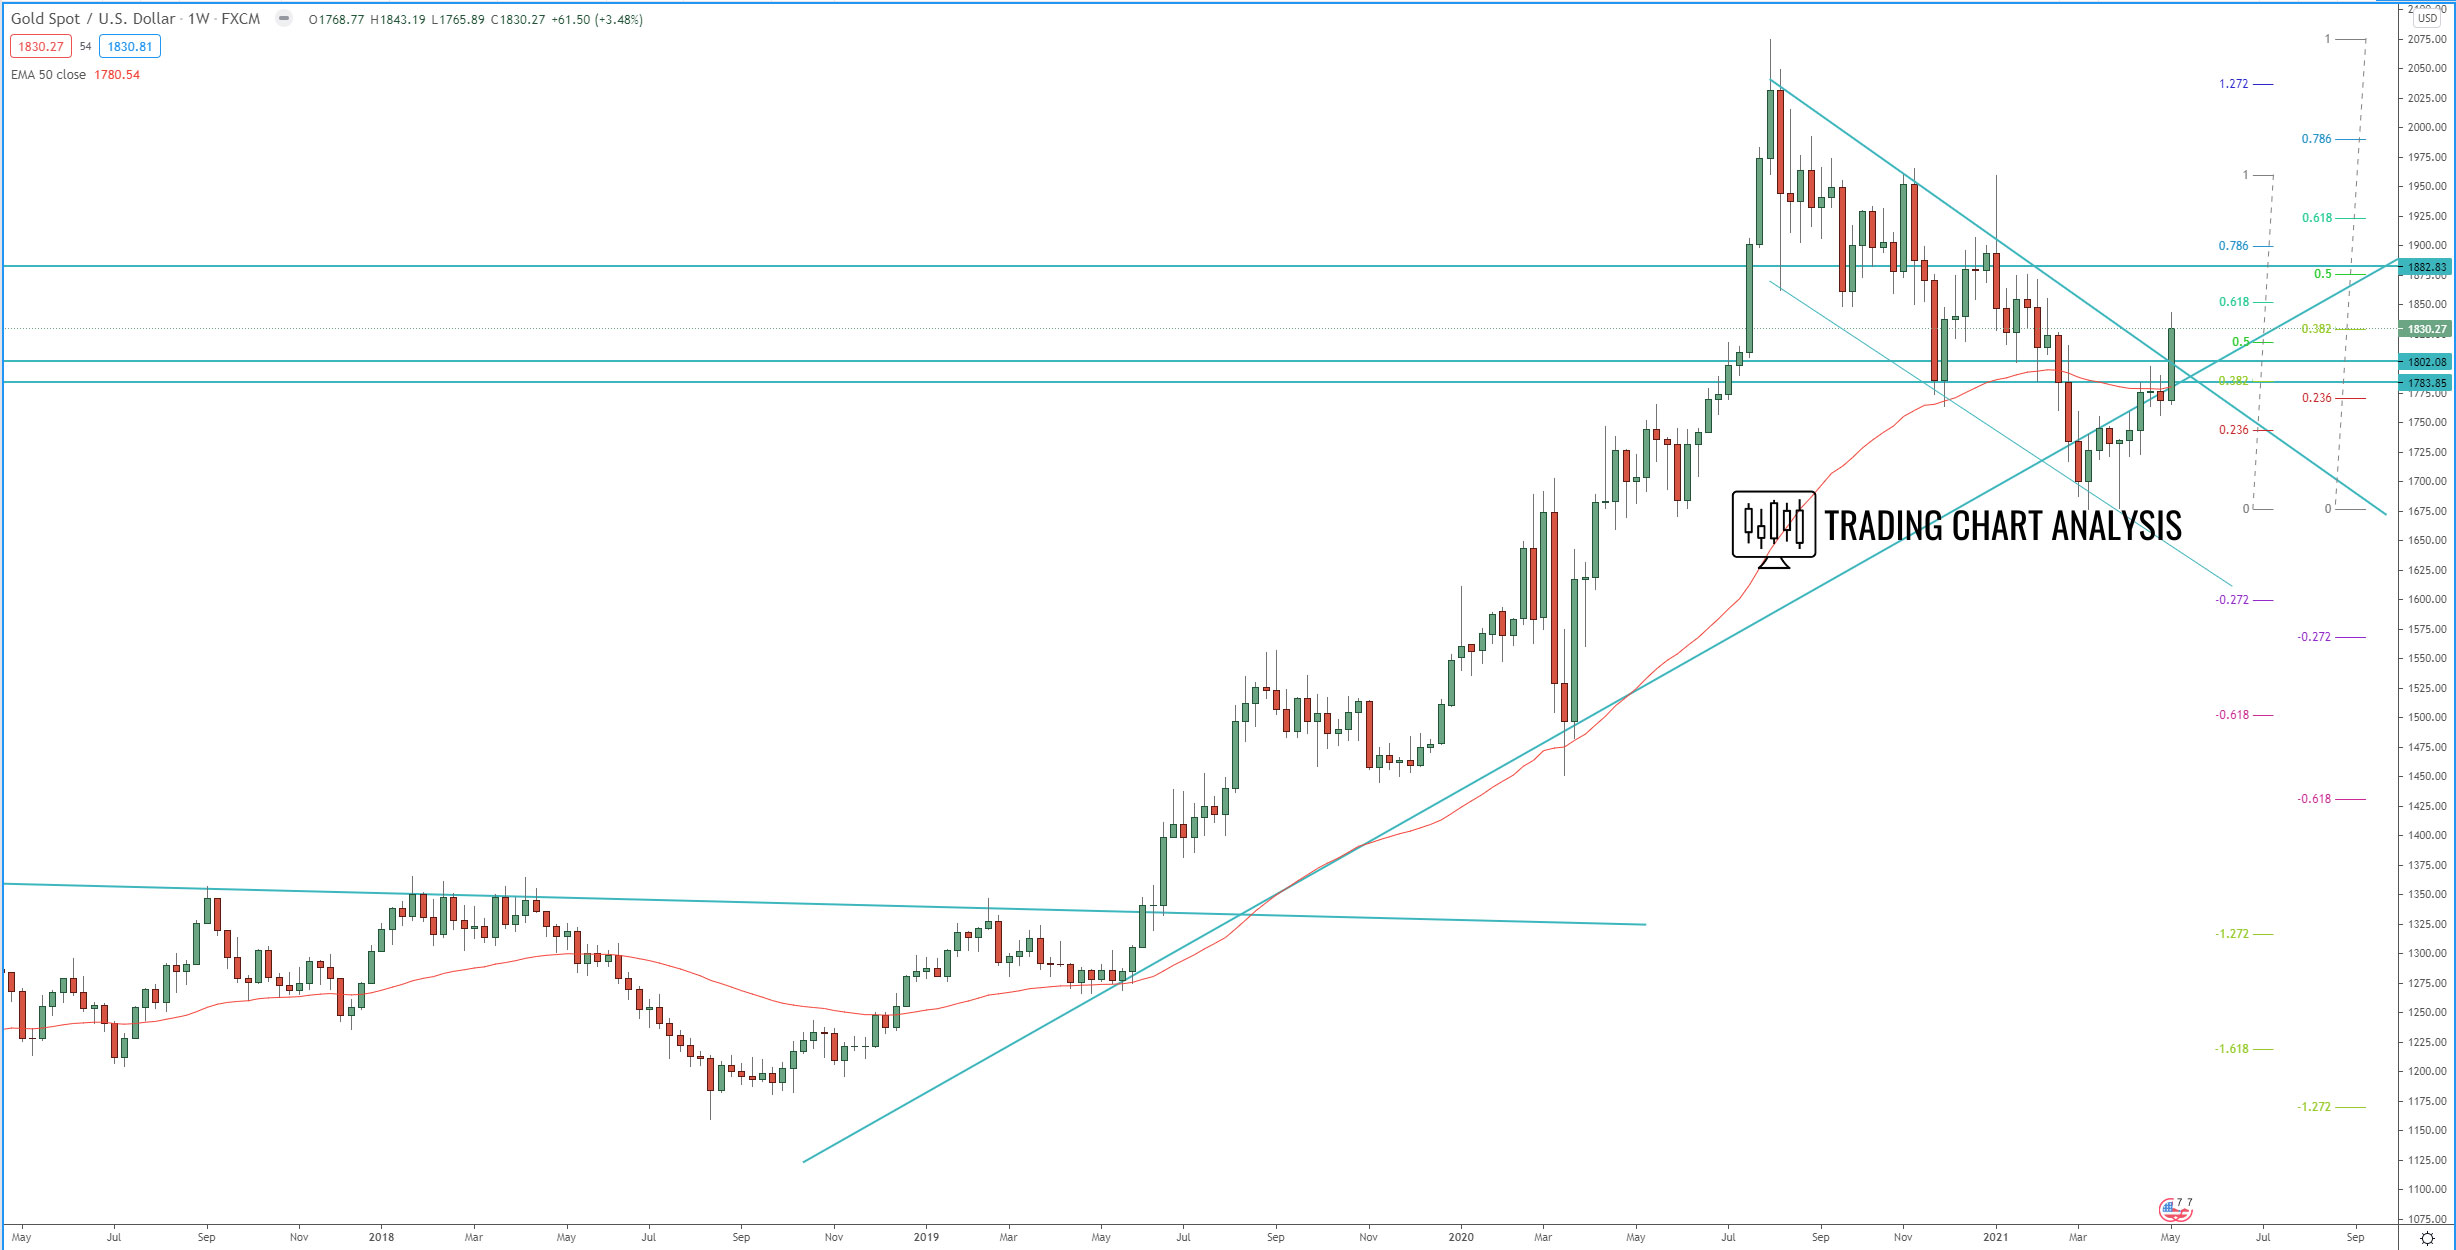
Weekly chart:
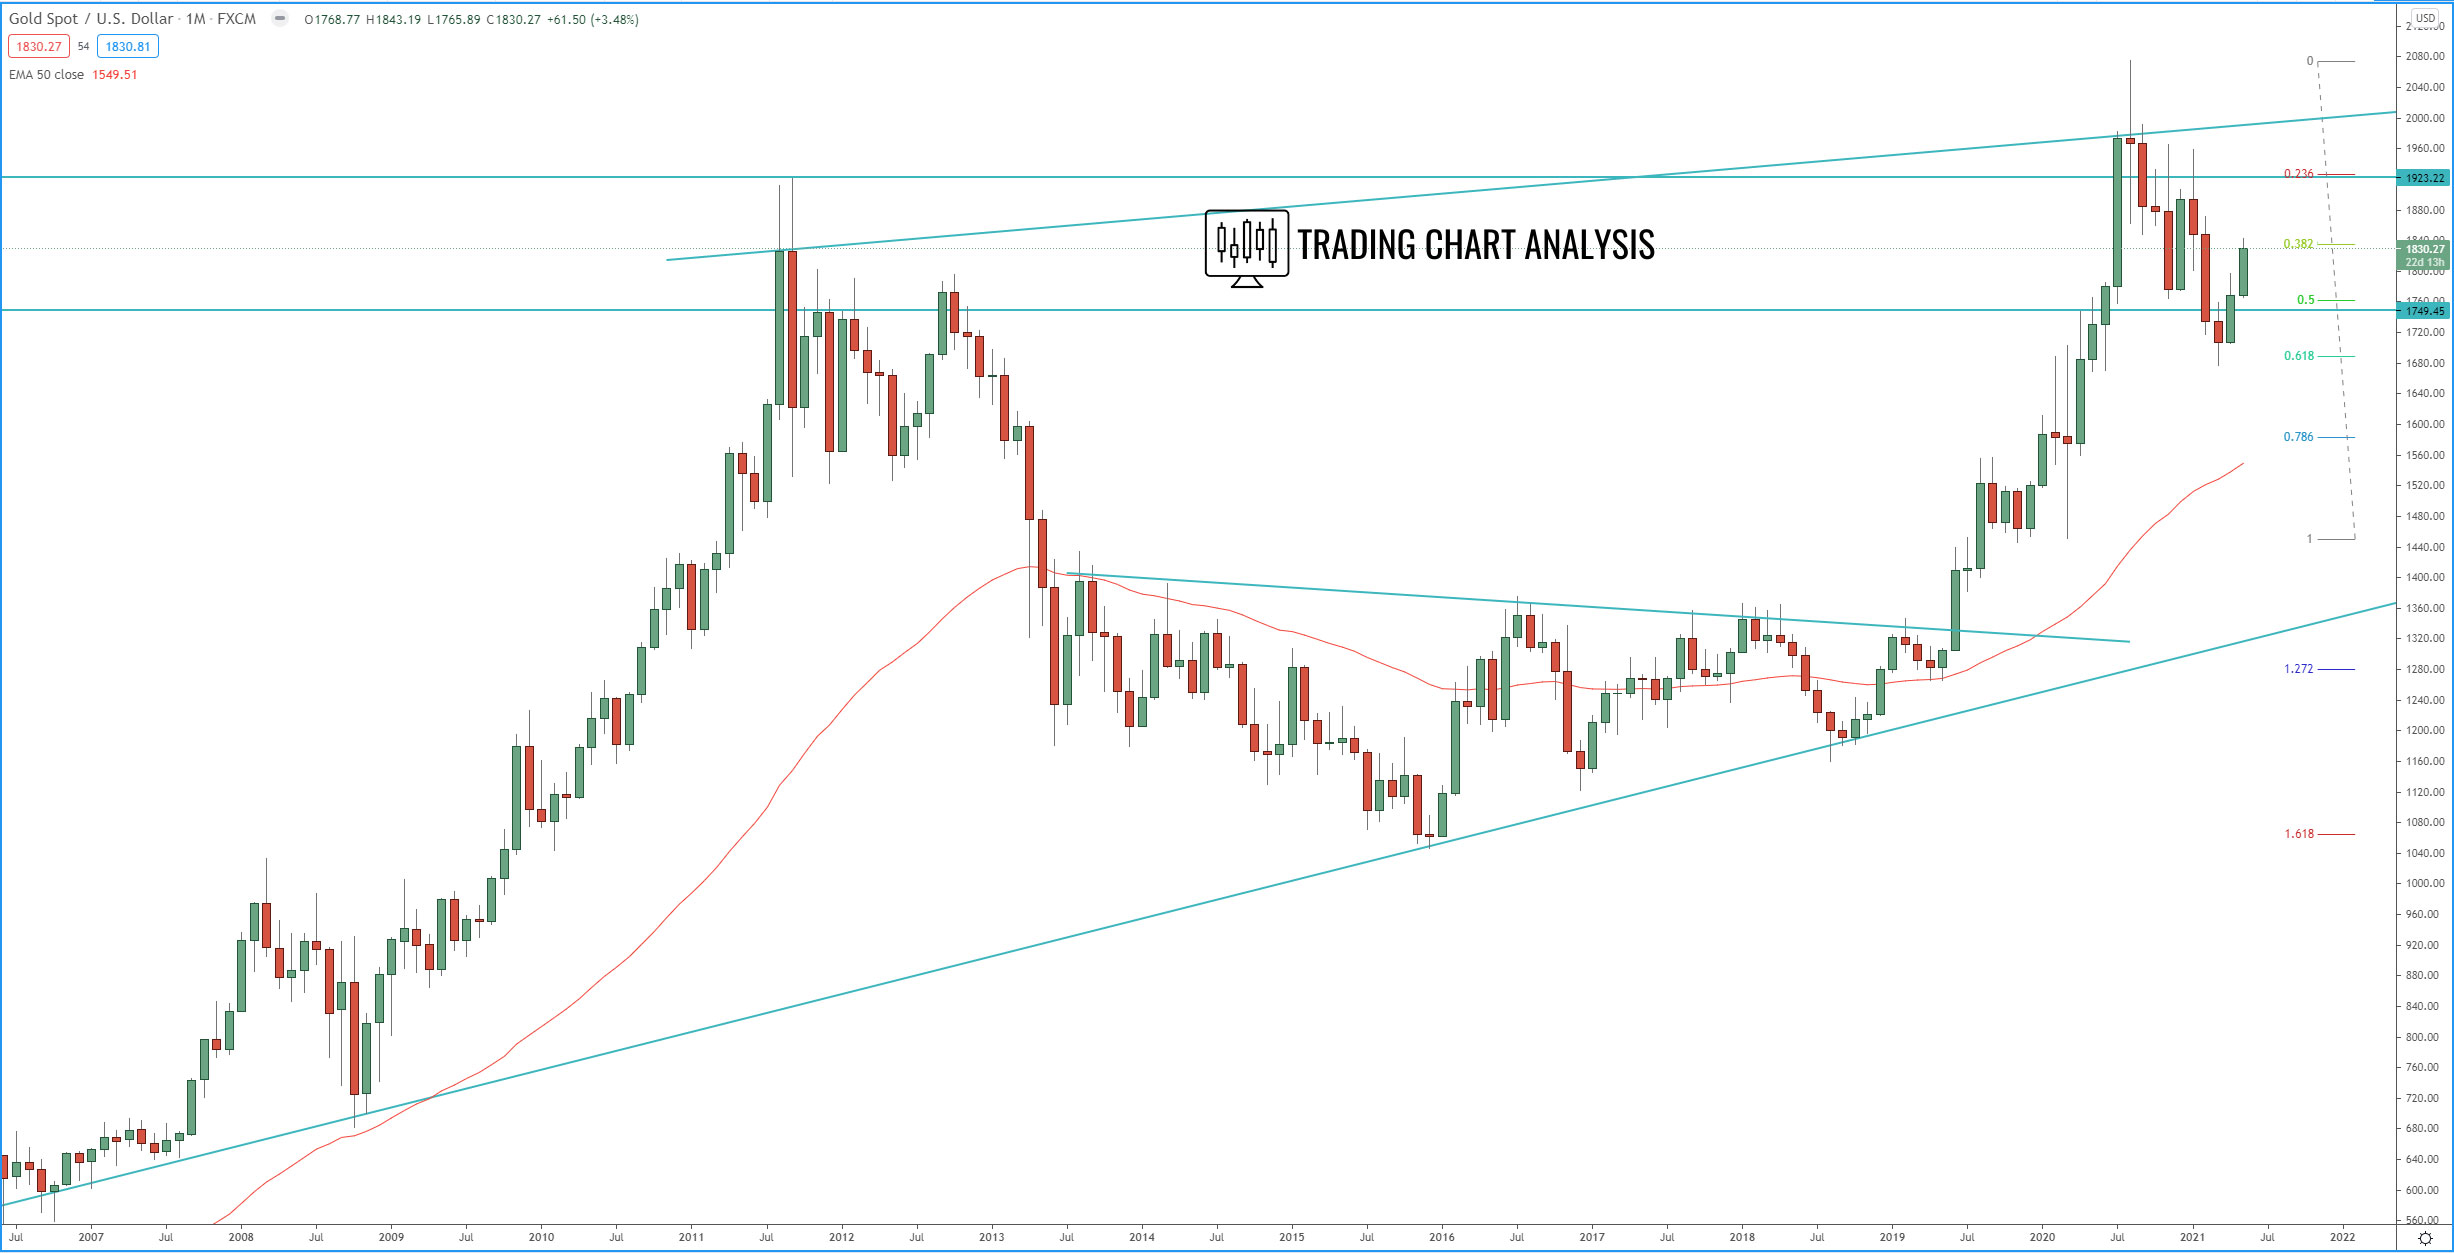
Monthly chart: