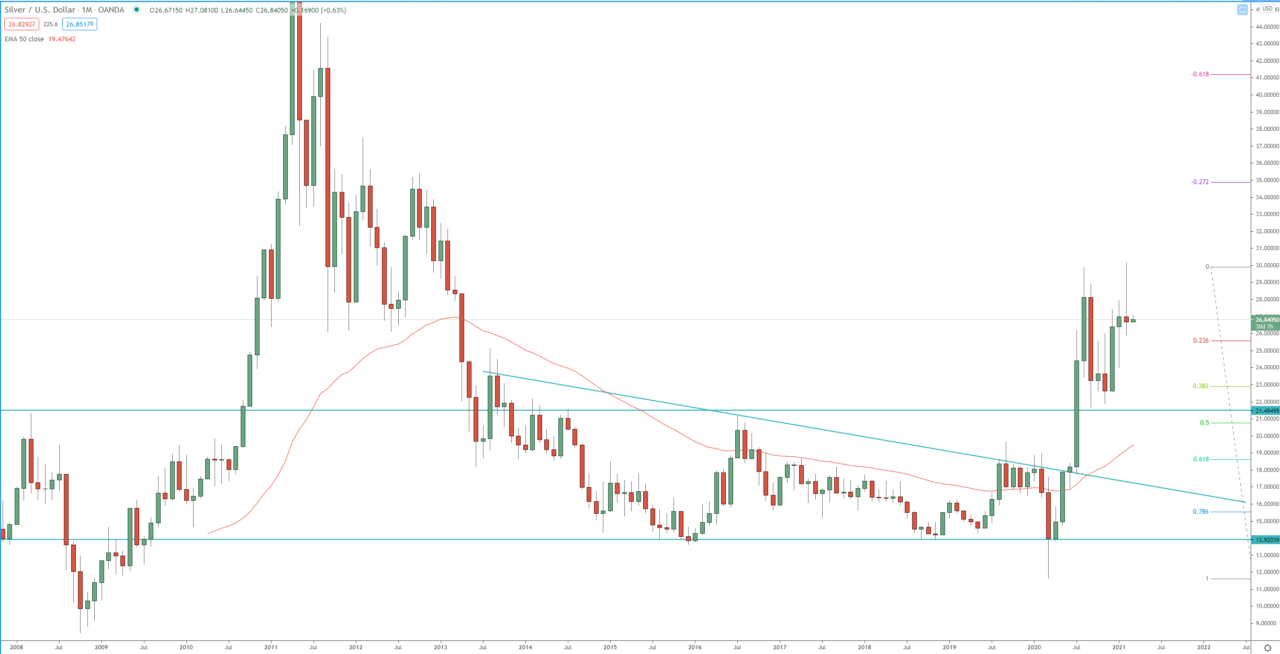
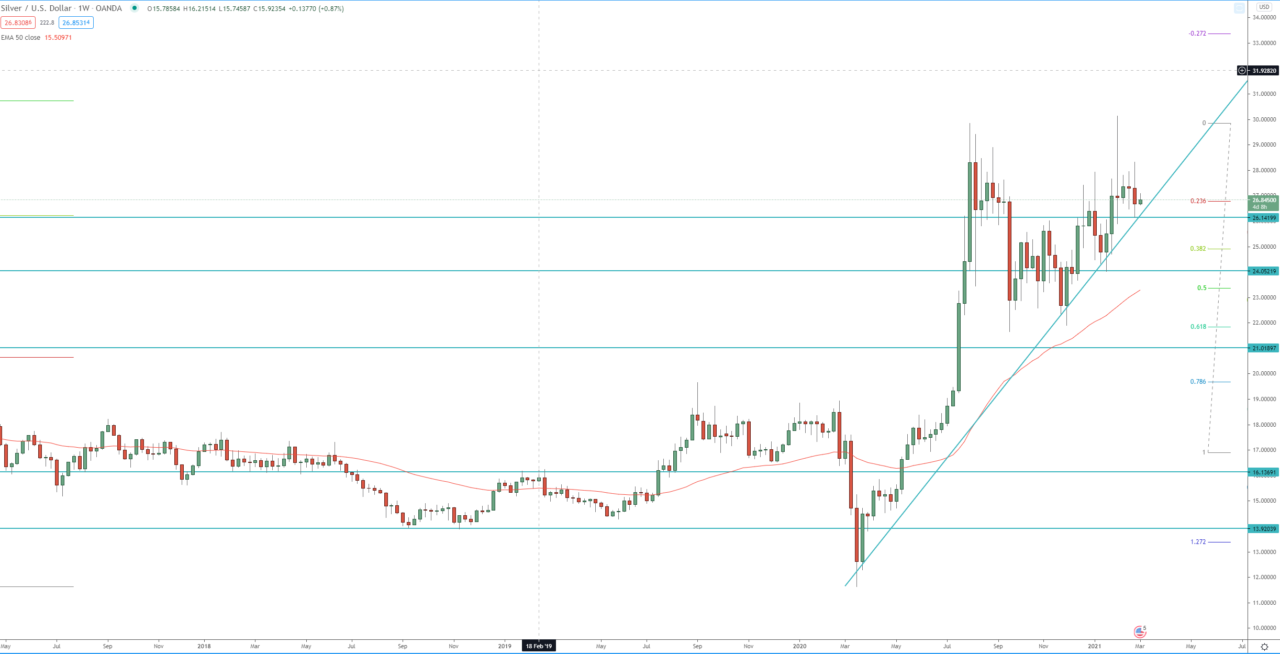
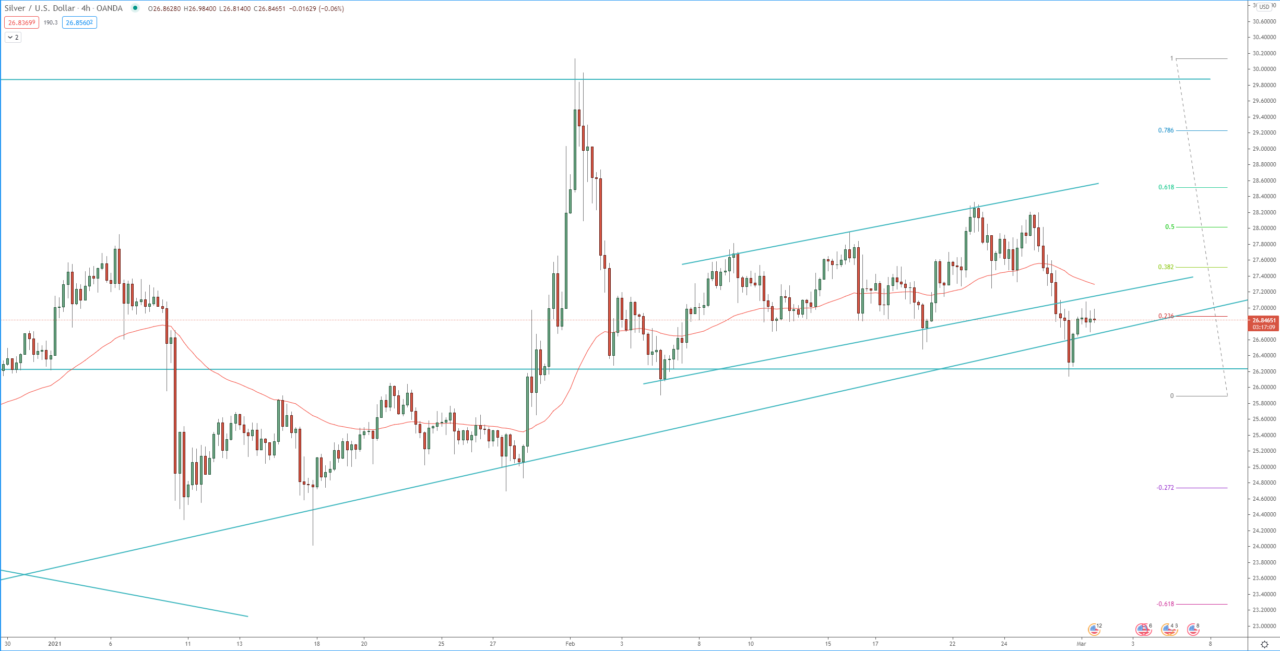
Silver high-test candle on the monthly chart, and double tops, on the weekly, signaling a potential pullback in the price. On the 4H chart, the price broke below a bearish flag. The first target of this break is at 1.272 FIB extension around 23.00, the second target is at 1.618 FIB extension around 21.50. However, before that, we need to see a break below the dynamic support (ascending trend line), and the previous low at 25.90 and then break below 24.00.
If the price break above 28.32, it will invalidate that bearish view and send the price back toward the 30.00.
Review our technical analysis for Silver, XAG/USD for 2021.
Monthly chart:

Weekly chart:

4H chart:


