|
Getting your Trinity Audio player ready...
|
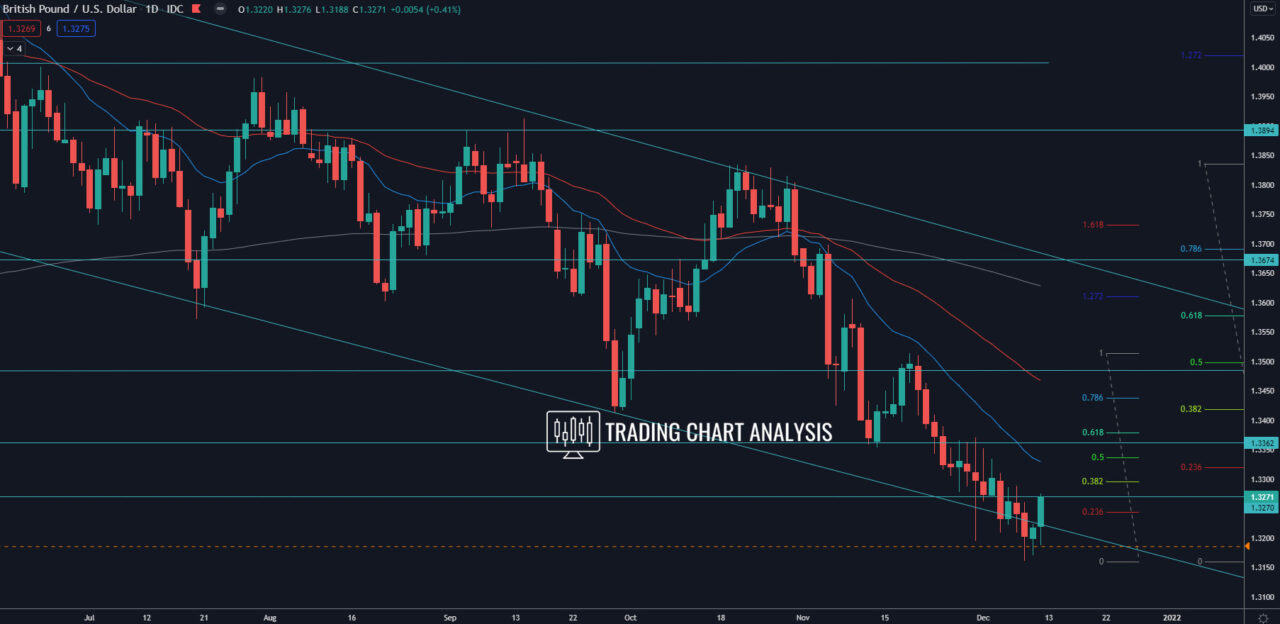
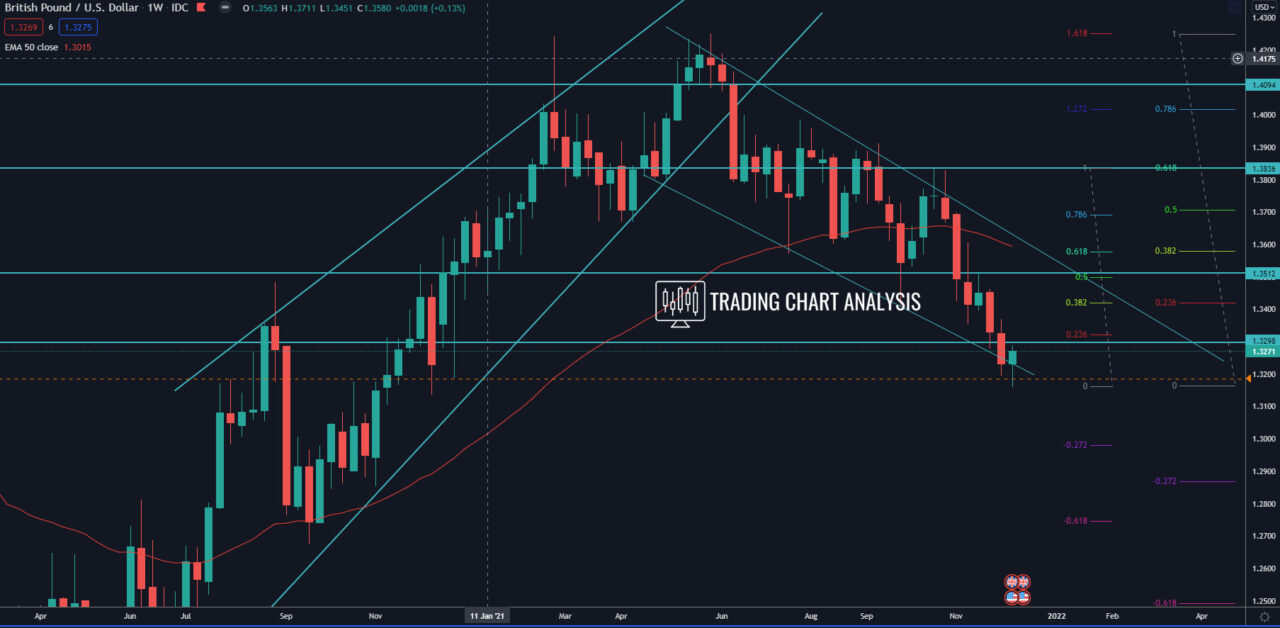
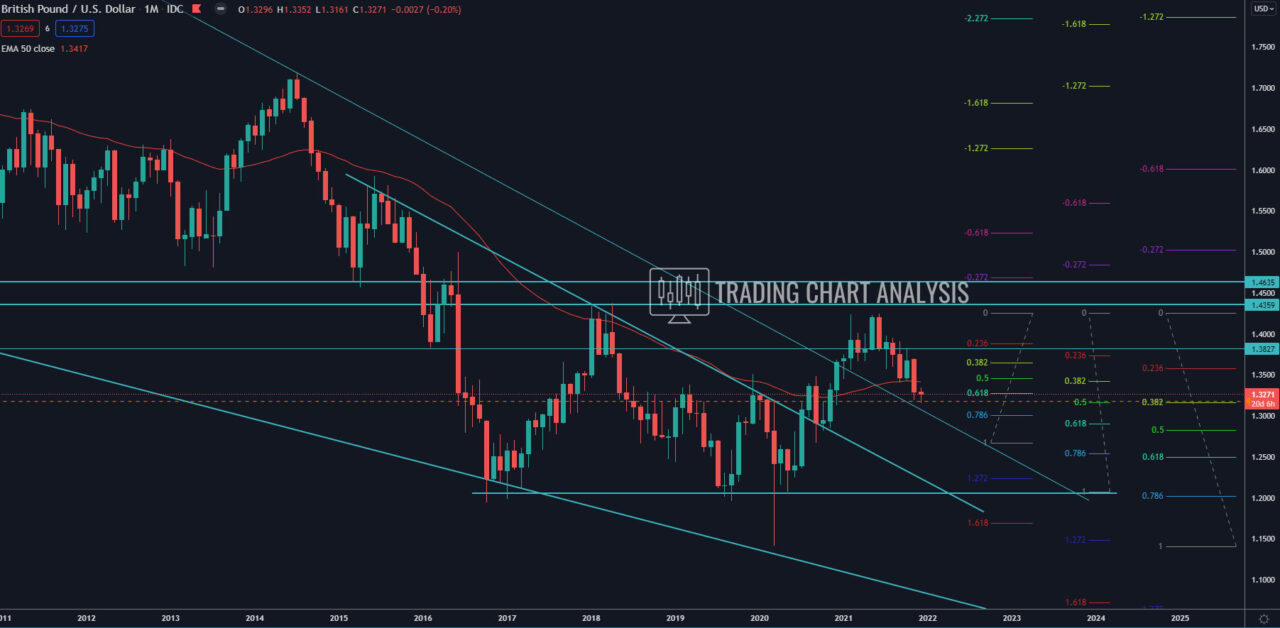
Technical analysis for the GBP/USD, the pair close the week with a low-test candle on the weekly chart. The price bounced from 0.500 and 0.386 FIB retracements on the monthly chart at 1.3170, which is a signal for a pullback. The first target of the pullback is the 0.386 FIB retracement on the daily chart at 1.3295. The second target is the resistance between the 0.500 and 0.618 FIB retracement at 1.3330 – 1.3380. The third target is the 0.386 FIB retracement on the weekly chart at 1.3420.
On the other hand, if the GBP/USD breaks below the 0.500 and 0.382 FIB retracement on the monthly chart at 1.3170, it will open the door for further declines. The first target for this potential breakdown is the zone between 0.618 FIB and 0.500 FIB retracements at 1.2910-1.2840.
Daily chart:

Weekly chart:

Monthly chart:


