|
Getting your Trinity Audio player ready...
|
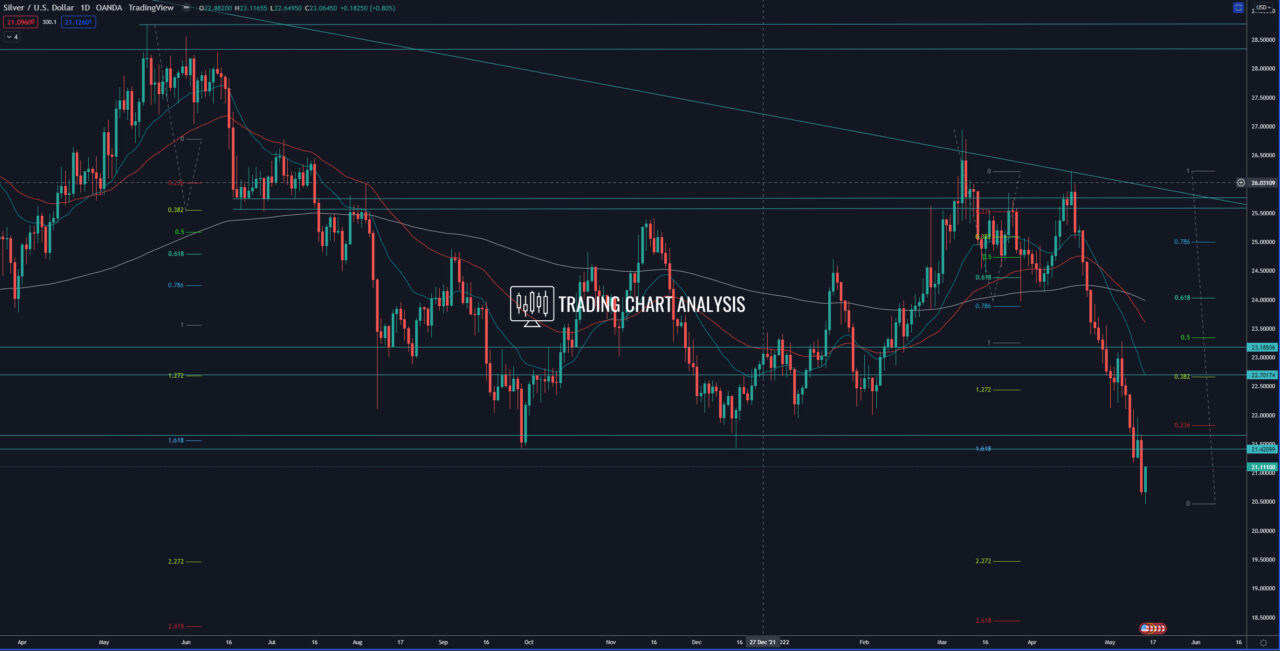
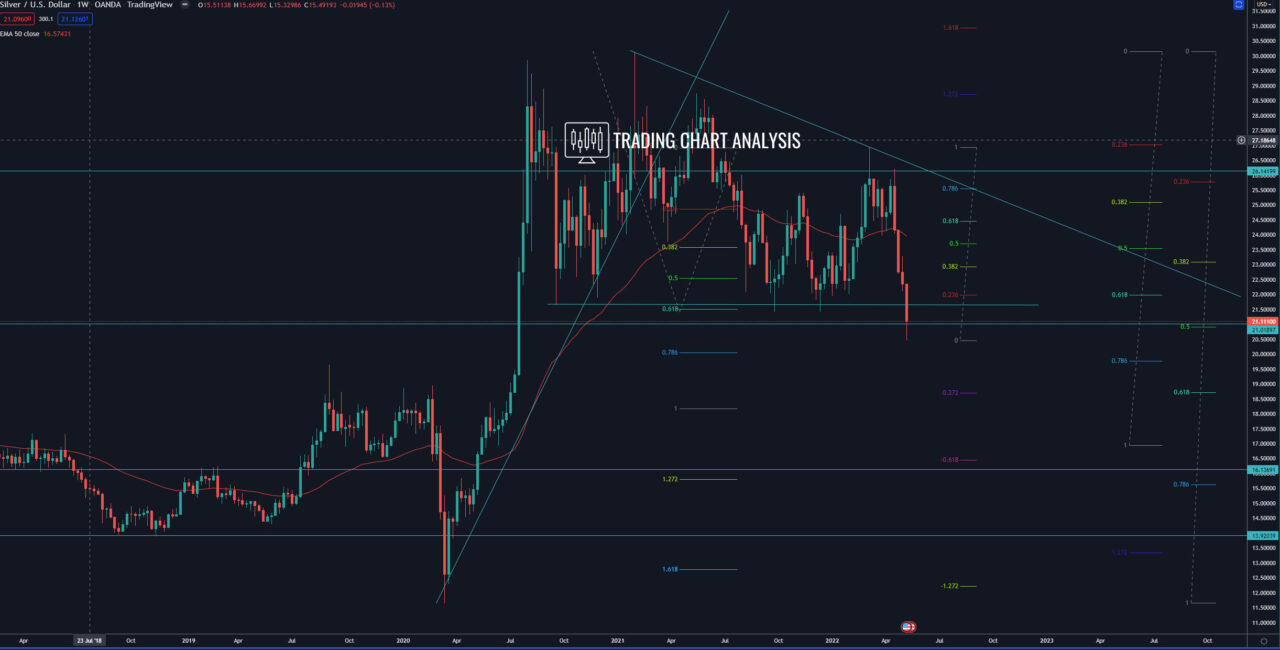
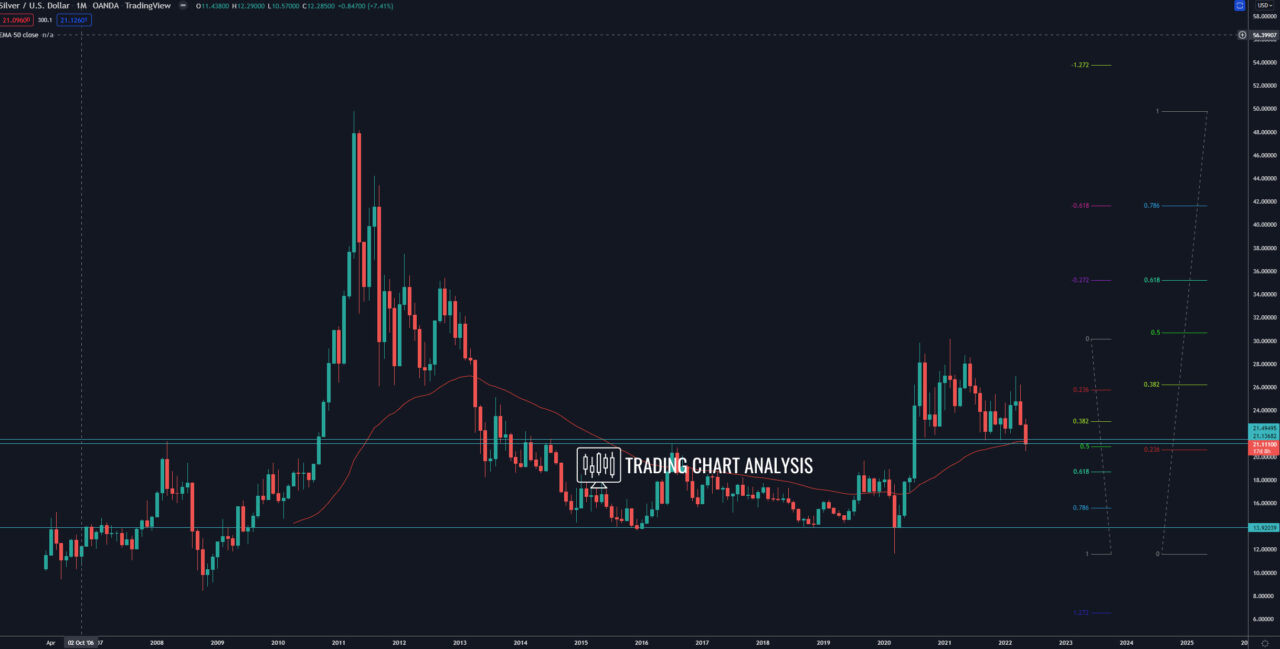
Technical analysis for Silver, the price of XAG/USD closed below the double bottom on both the weekly and the daily charts, which is a signal for further declines. The first target for this breakout in XAG/USD is the 0.618 FIB retracement on the monthly chart at 18.70. The second target is the 1.272 FIB extension on the weekly chart at 15.80.
We must keep in mind that the price of Silver (XAG/USD) is still holding a support range between 21.15 – 21.35, and the monthly 50 EMA, we need to see a break below on the weekly chart, which will clear the way for the run toward the 18.70.
The price of Silver is oversold on the daily chart and in a need of a pullback. However, we still don’t have any signs of a pullback. On the one-hour chart, the price of XAG/USD formed a descending price channel. If the price of Silver breaks above that price channel, that will start a pullback. The first target for this potential pullback is the 0.382 FIB retracement on the daily chart at 22.60. The second target is the high on the daily chart at 23.28, where we also have resistance.
Daily chart:

Weekly chart:

Monthly chart:


