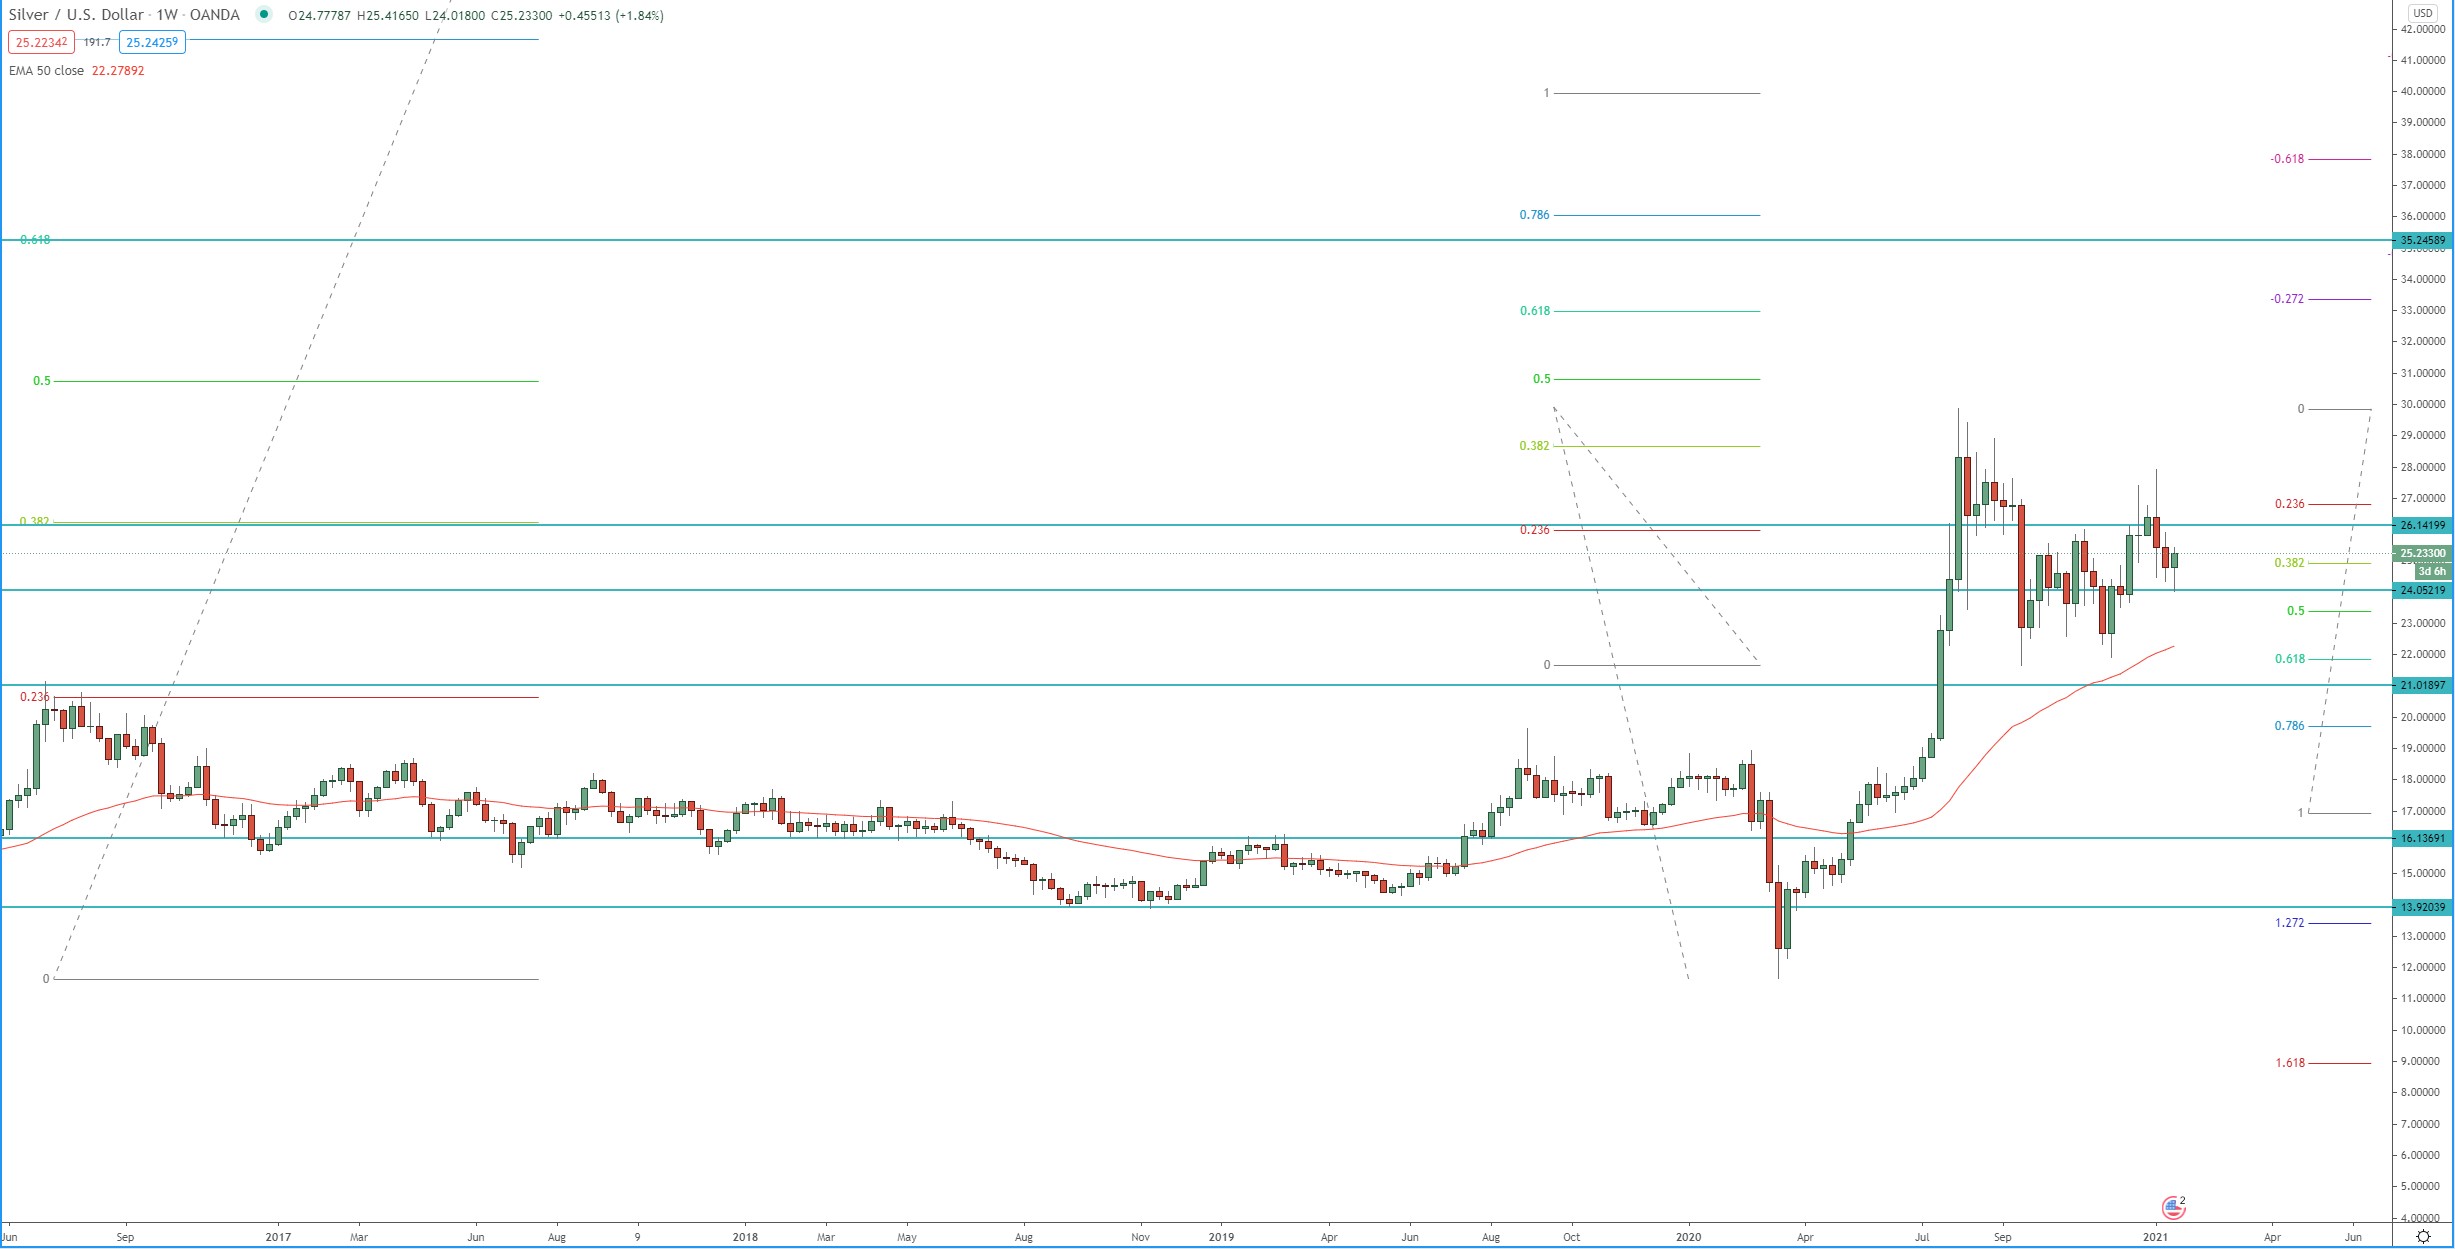
Looking at the monthly chart, we can see that the price broke above ascending triangle on the monthly and accelerate to the upside. This break out started bullish trend on the weekly and the daily chart.
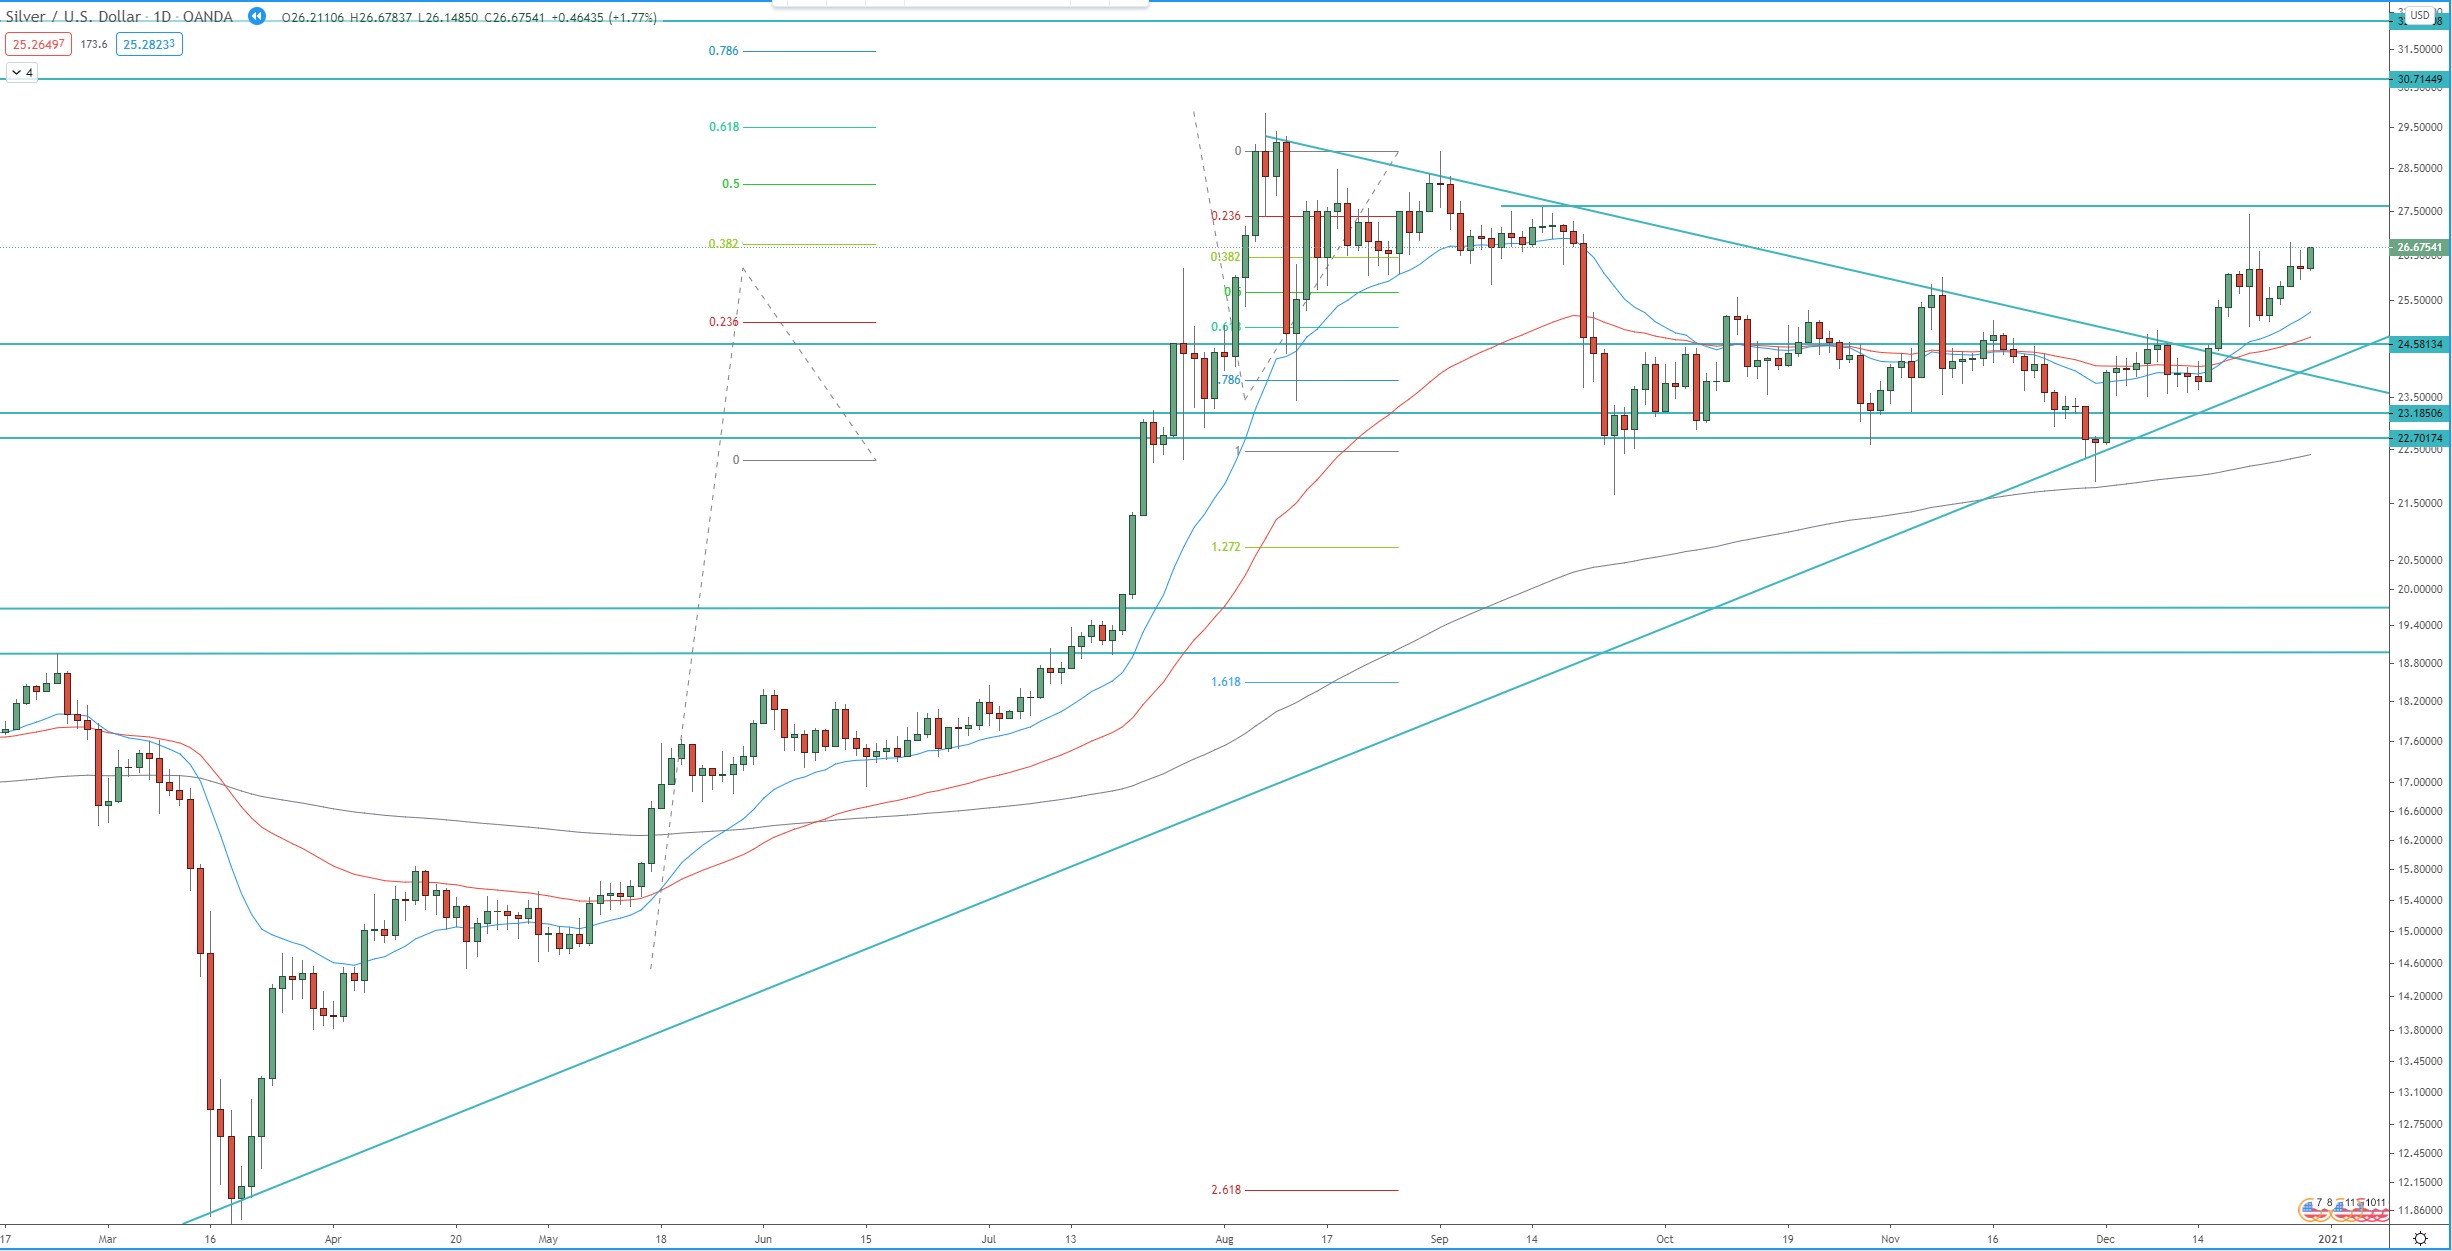
The price reached the target of the 5th daily bullish trend at 0.618 FIB around 29.50 and now the price is consolidating in a descending triangle on the daily chart. The break out of this triangle that appeared on December 15 2020 should send the price toward 29.50 – 29.85.
Break above 30.00 will resume the 3rd bullish weekly wave and send the price toward 35.00 resistance.
Monthly chart:

Weekly chart:
Daily chart: