|
Getting your Trinity Audio player ready...
|
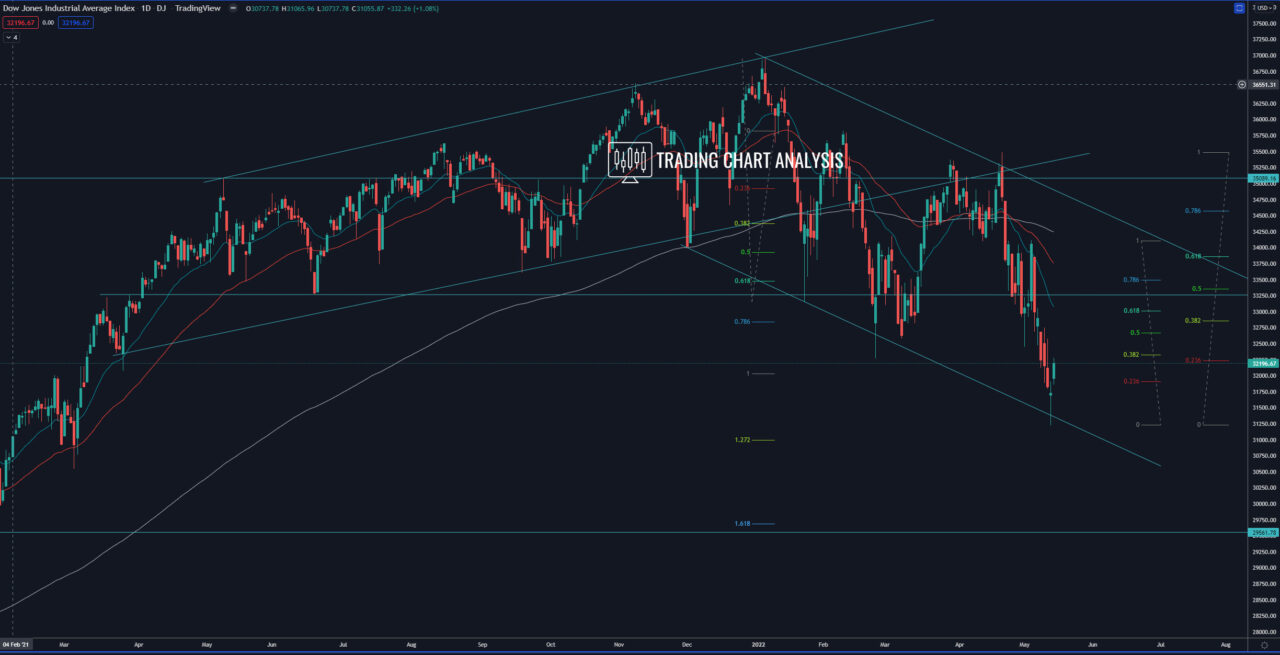
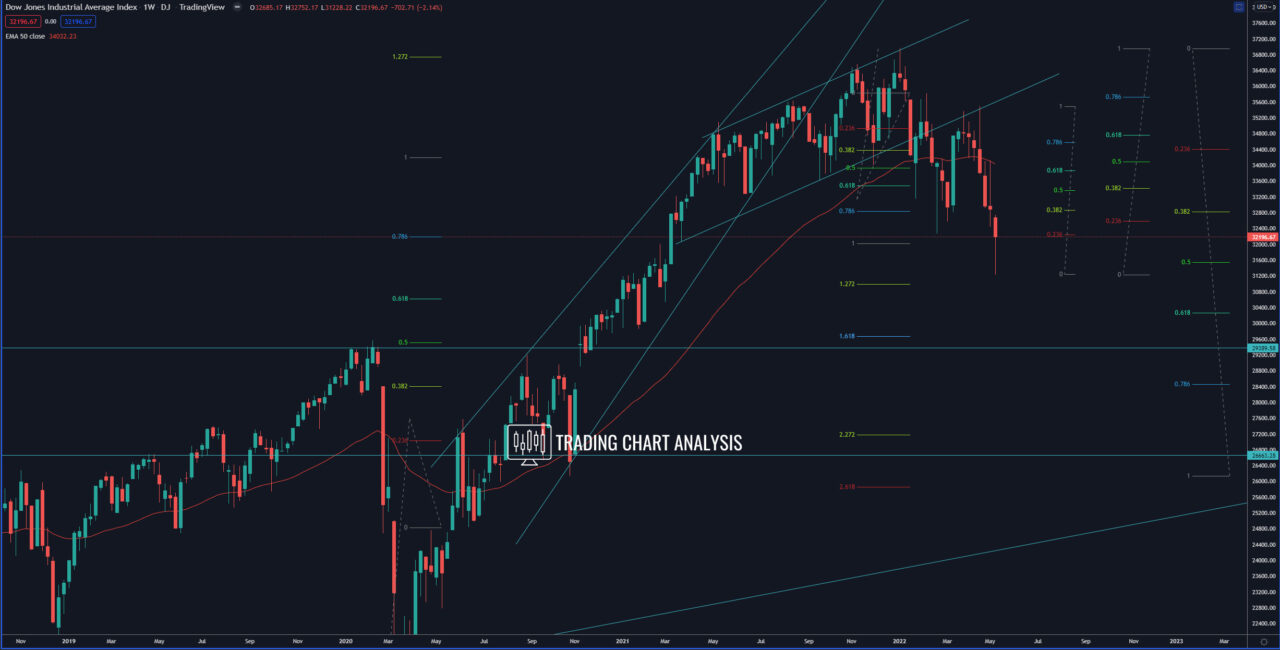
Technical analysis for Dow Jones Industrial, the index formed a morning star pattern on the daily chart, signaling a potential pullback. The first target for this pullback is the 0.382 FIB retracement on the daily chart at 32 850. The second target for the pullback in the Dow Jones index is the 0.382 FIB retracement on the weekly chart at 33 420. The third target is the 0.618 FIB retracement on the daily chart at 33 852, where we have the weekly 50 EMA. The fourth target is the 0.618 FIB retracement on the weekly chart at 34 770.
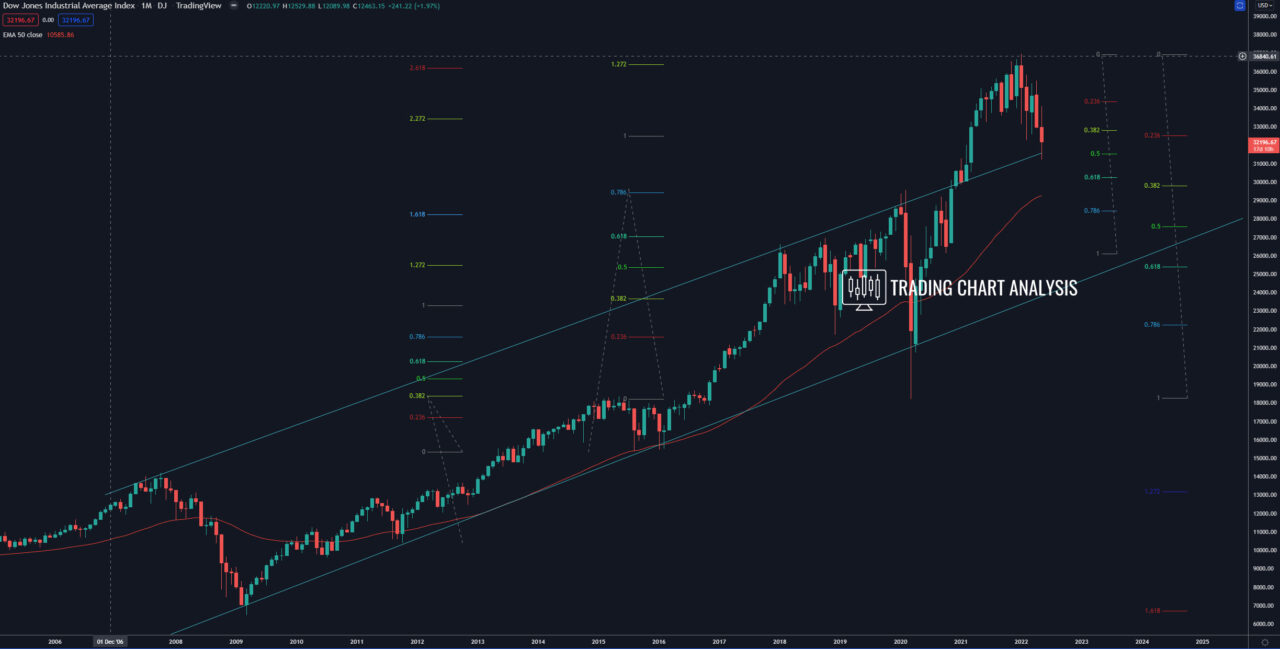
Looking at the bigger picture, the Dow Jones index, closed below the 0.382 FIB retracement on the weekly chart at 32 800, which started a bearish wave on the weekly chart. The first target for this bearish wave on the weekly chart is the 1.272 FIB extension around 31 000 – 30 980. The second target is the 1.618 FIB extension at 29 670, and just above that, we have the 0.382 FIB retracement on the monthly chart.
Daily chart:

Weekly chart:

Monthly chart:


