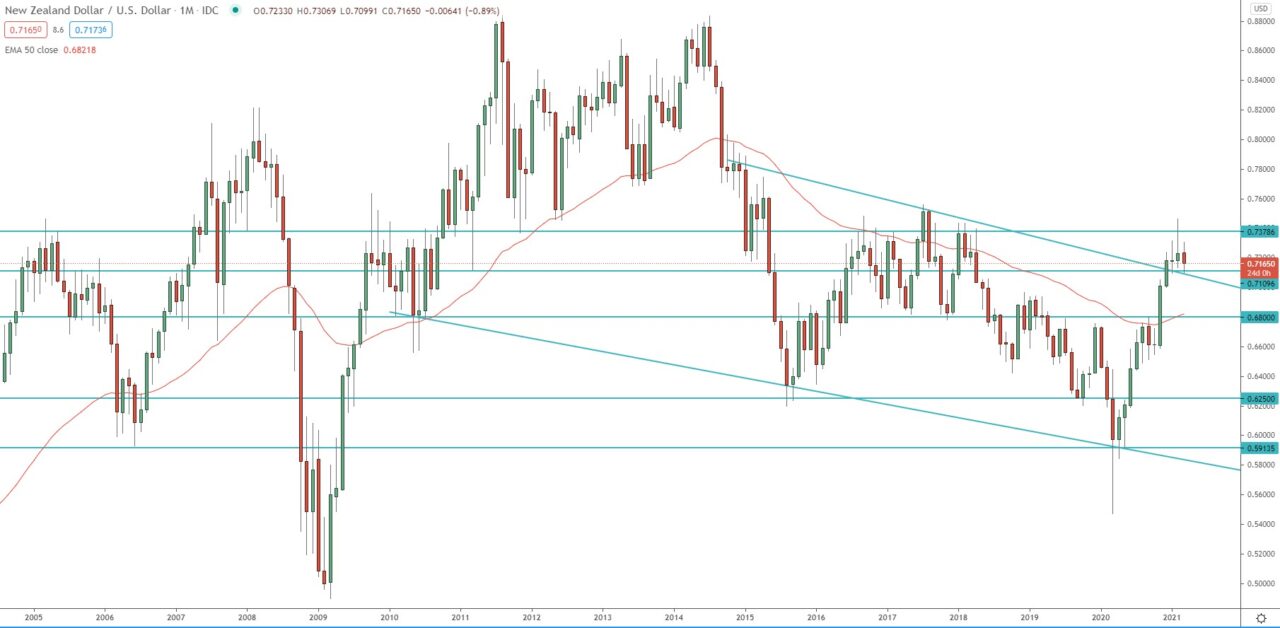
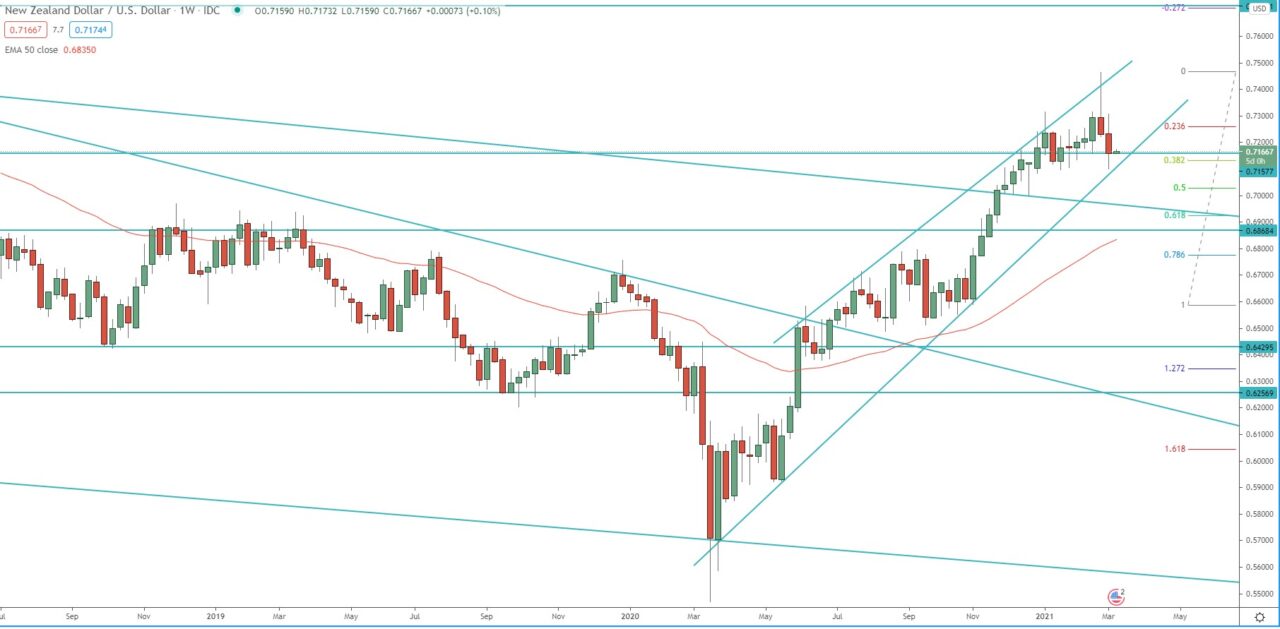
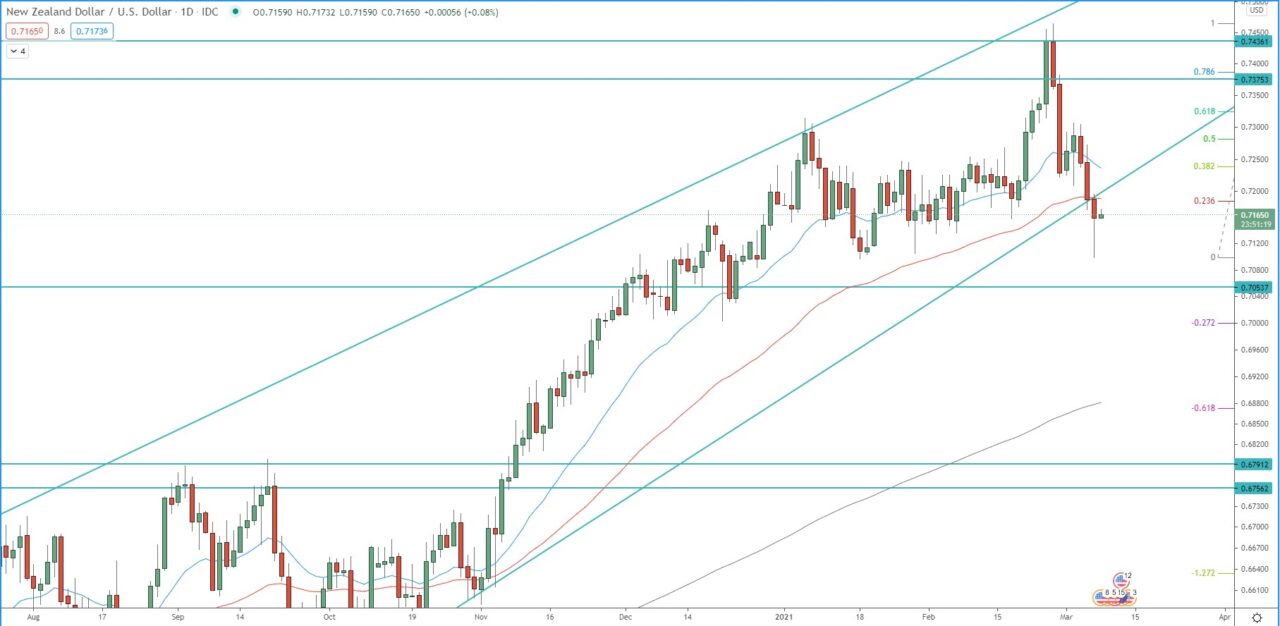
The pair formed tweezer tops on the monthly chart, high-test candle on the weekly chart, which materializes as an ABC pullback on the daily chart. The price reached both horizontal and dynamic support on the weekly chart around 0.7100. If the price break below the previous week’s low, below 0.7095, it will extend the decline toward, first 0.7050, then toward 1.272 FIB extension around 0.6980.
On the other hand, if the price breaks back above 0.7306, it will send the NZD/USD back toward the previous high at 0.7446.
Review our technical analysis for NZD/USD for 2021.
Monthly chart:

Weekly chart:

Daily chart:


