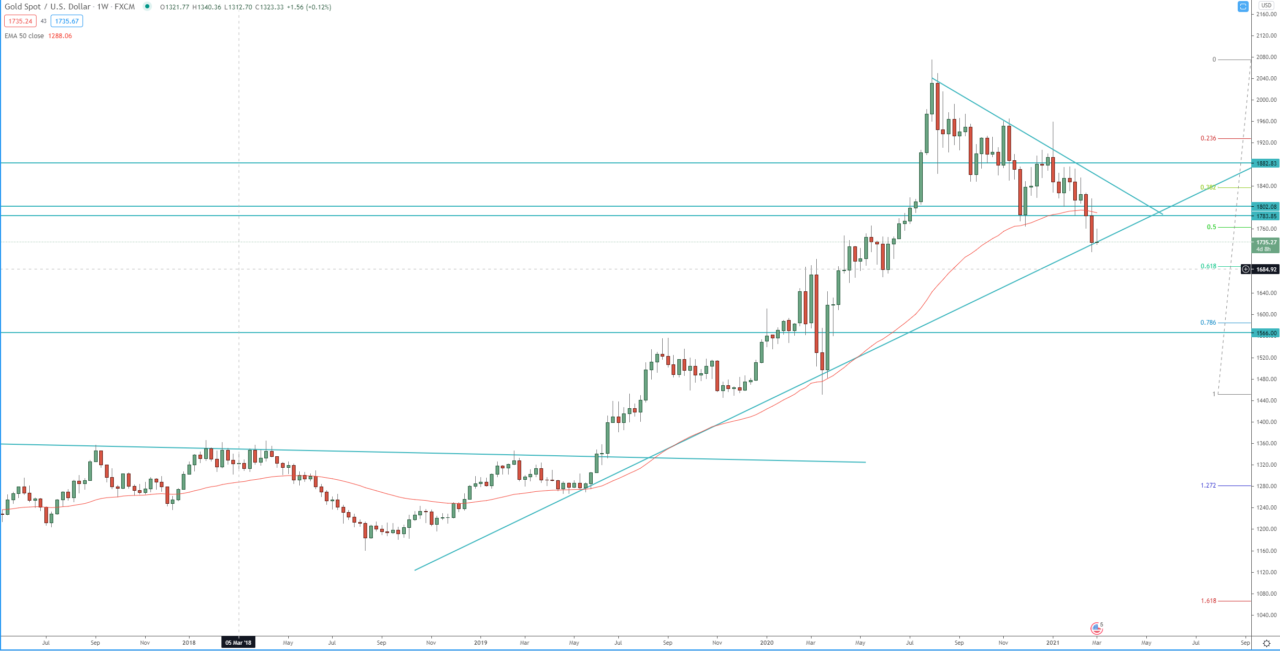
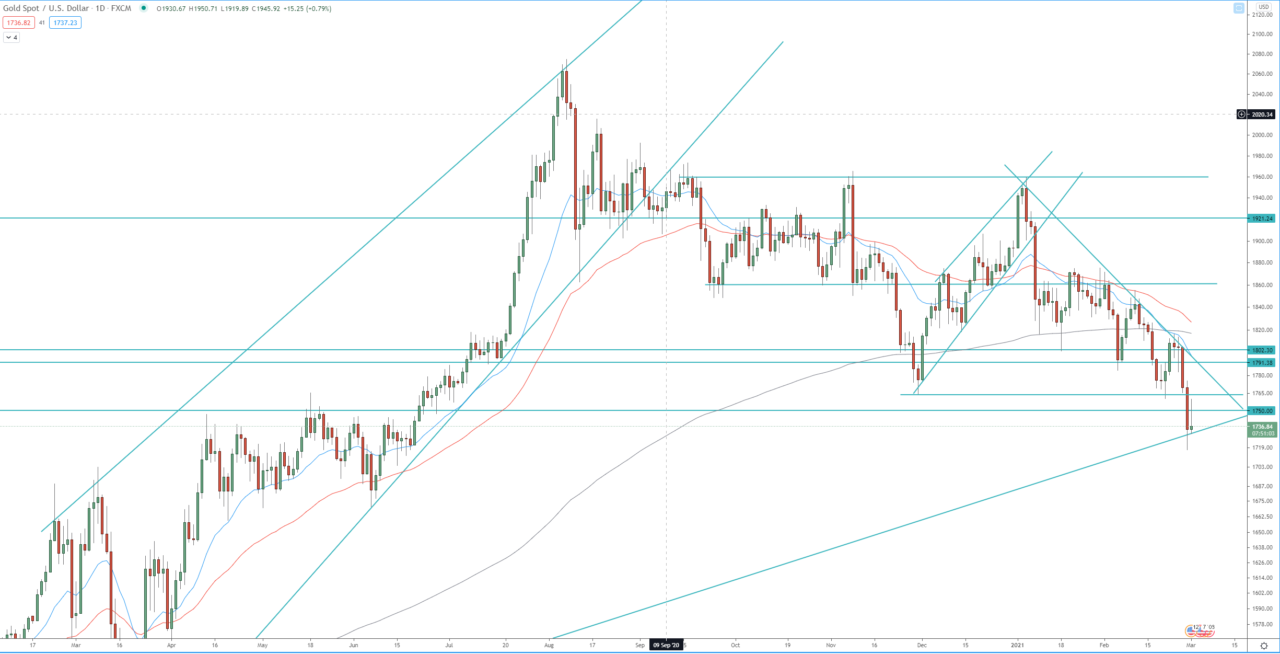
The price broke below the double bottoms and support level around 1765 on both, the weekly and the daily charts, extending the weekly pullback. The break continues the 3rd bearish daily wave and reached the first target of that wave at 1.272 FIB extension at 1744, the second target is at 1.618 FIB extension at 1670. However, the price is sitting on dynamic support, ascending trend line on both, the weekly and the daily charts, and we need to see a break below that to confirm further decline.
Resistances to watch are 1765 and the zone between 1800 – 1816.
Review our technical analysis for 2021 for Gold, XAU/USD.
Weekly chart:

Daily chart:


