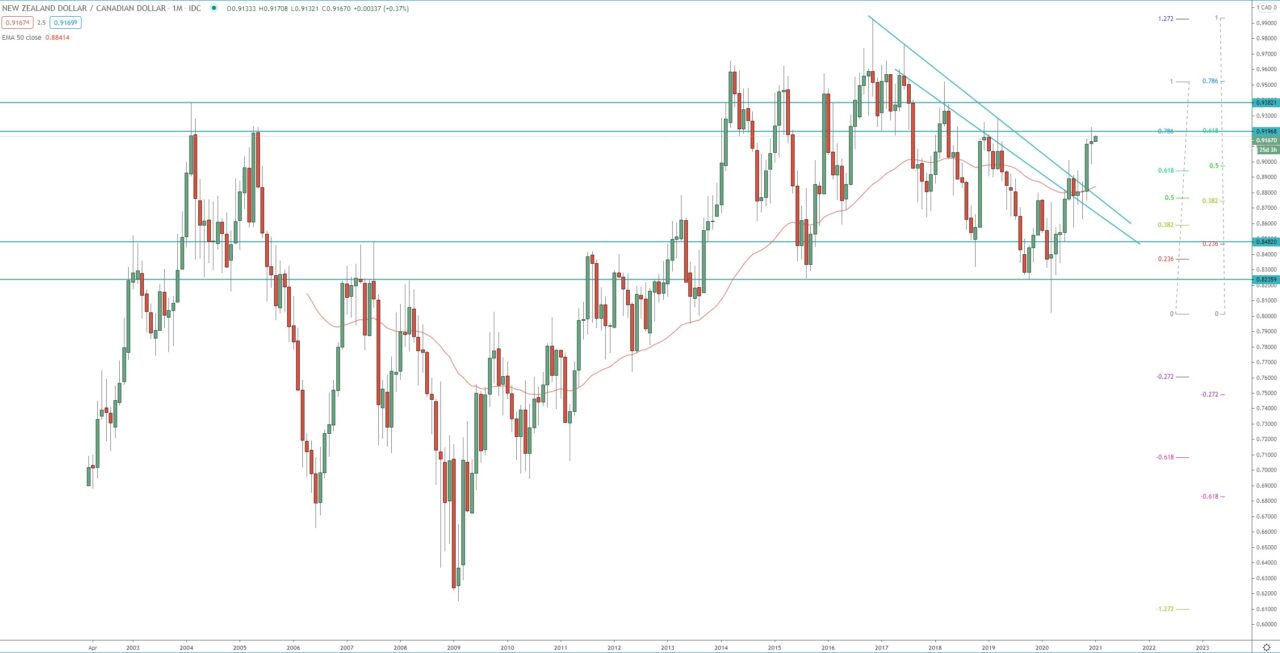
Analyzing the monthly chart we can conclude that the pair is in big range, the bottom of the range is the support between 0.8250 – 08480 and the top of the range is a big resistance zone between 0.9200 – 0.9600. However, while the price is within this range there are cycles which we can analyze and which are visible on both the weekly and the daily chart.
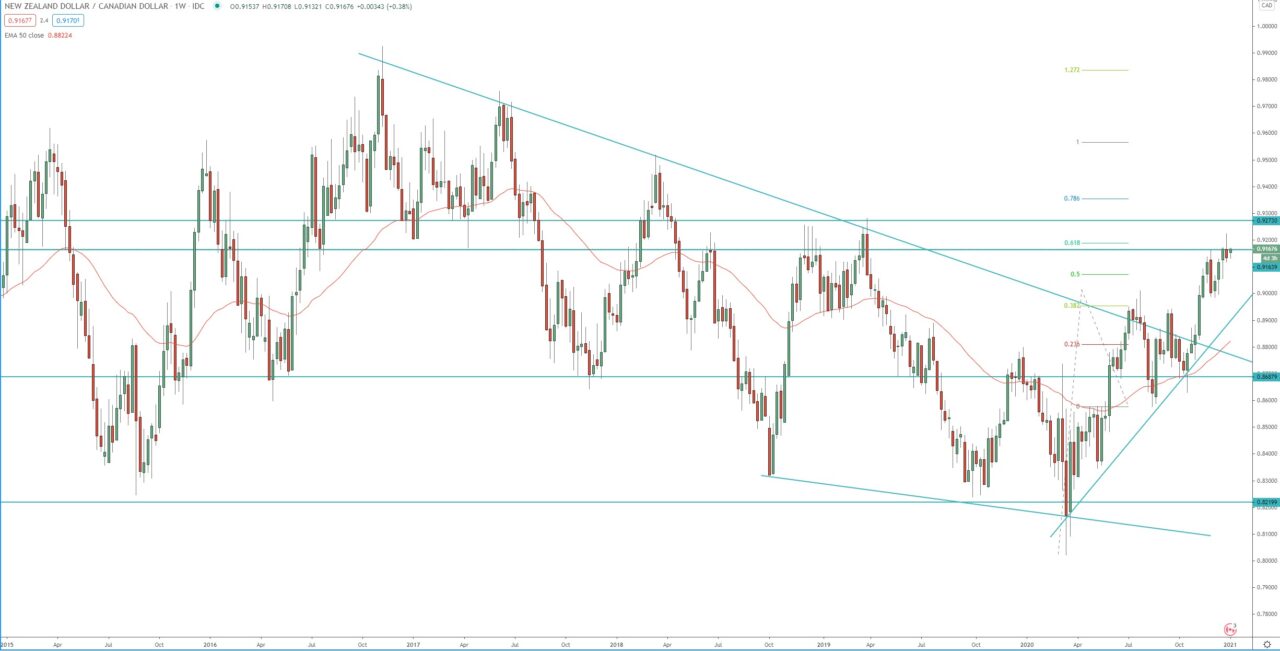
Looking at the monthly chart we can see that the decline that started in 2017 has completed with double bottoms in March 2020. Now the weekly and the daily are in their 3rd wave of their bullish trend. The first target of this bullish weekly run is the 1.272 FIB around 0.9830 which is close to previous all time high. The second target of the daily bullish 3rd wave is the 1.618 FIB around 0.9240 which is within strong resistance.
The resistance between 0.9240 – 0.9270 should be watched for rejection and pullback. If the price break and close above 0.9270 next target of the bulls is around 0.9500!
Monthly chart:

Weekly chart:


