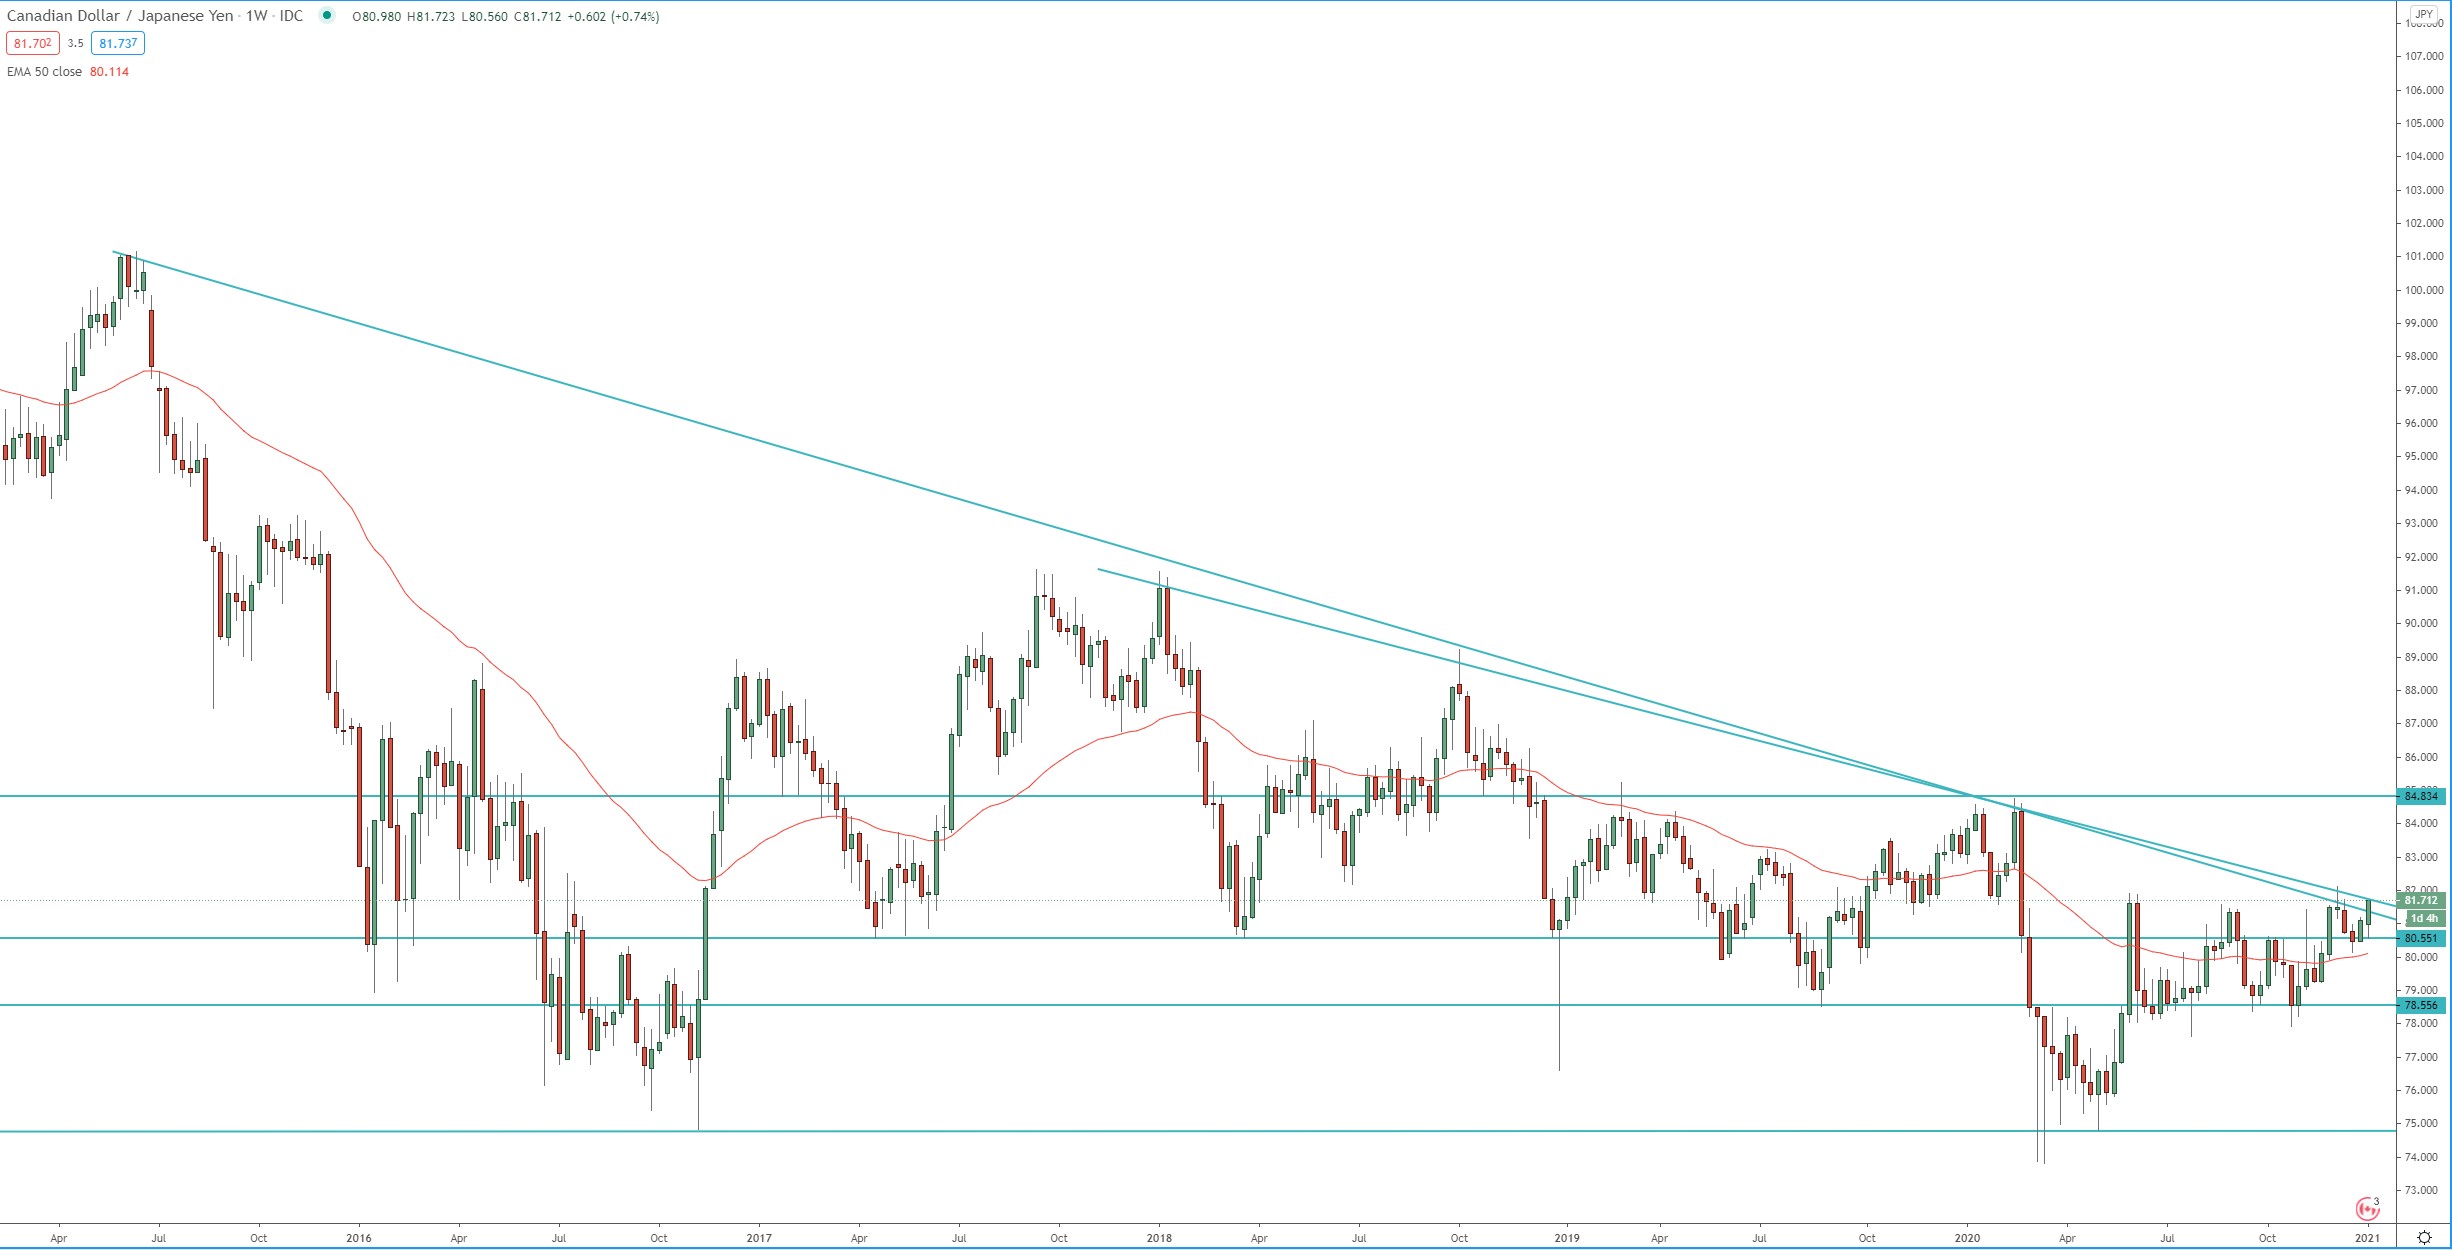
The pair rejected strong support around 75.00 and started a bullish run. At the moment the price is attempting break above both dynamic and horizontal resistance between 81.50 – 82.00. If we see break above that resistance, we may see rise first toward 84.50 – 85.00, and second toward 88.50 – 91.00 resistance.
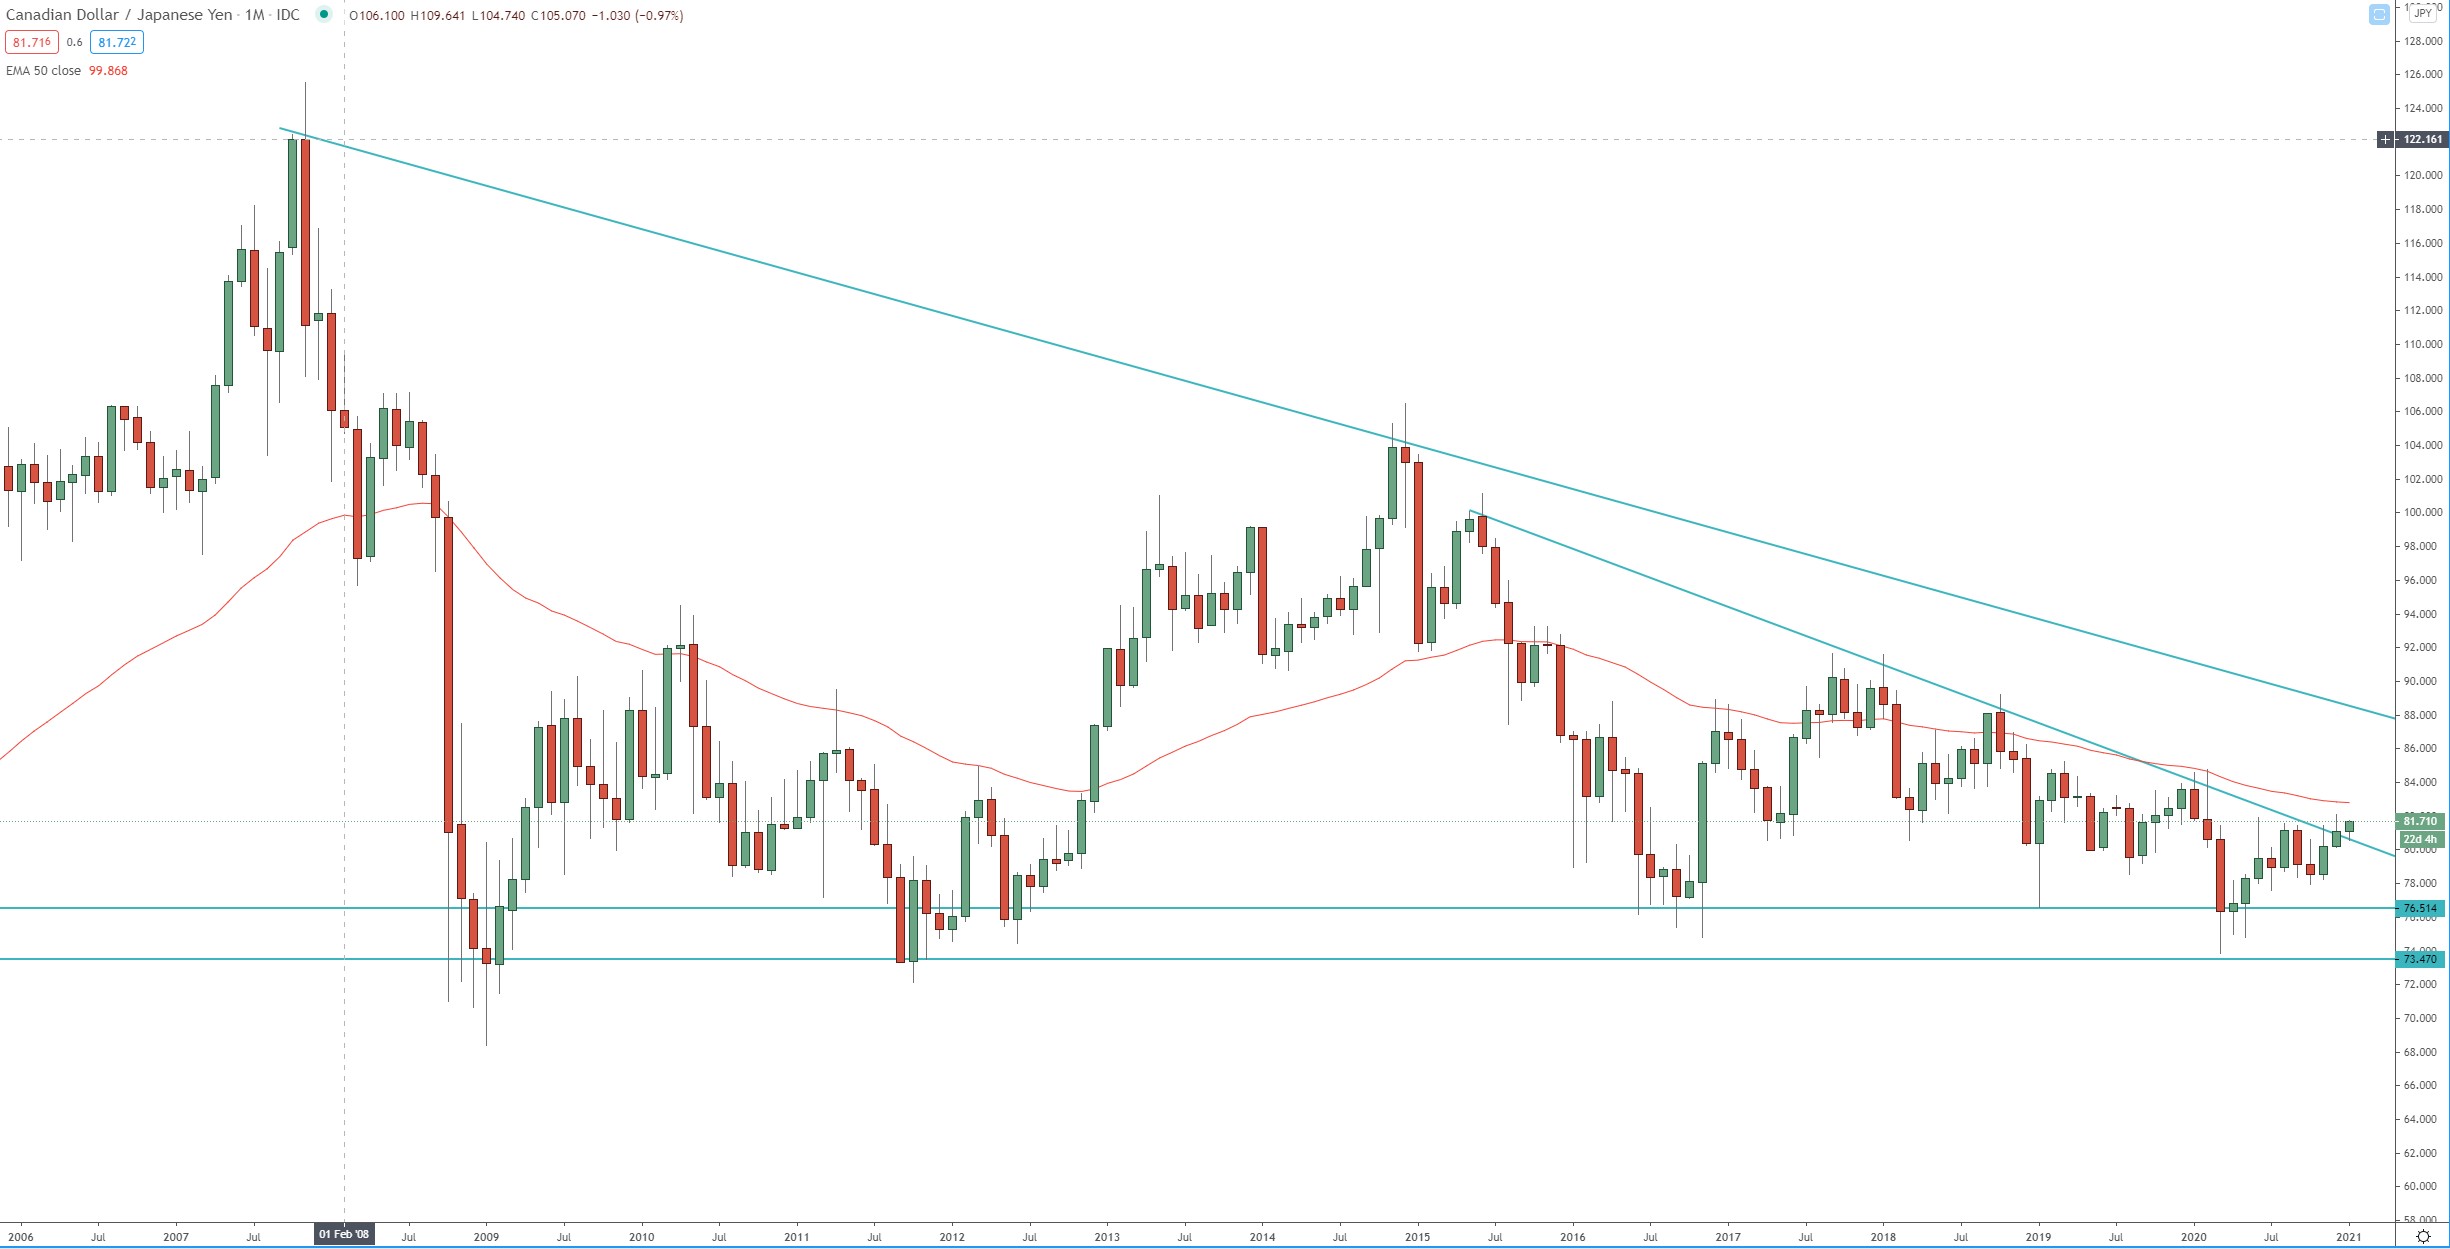
Monthly chart:
Weekly chart: