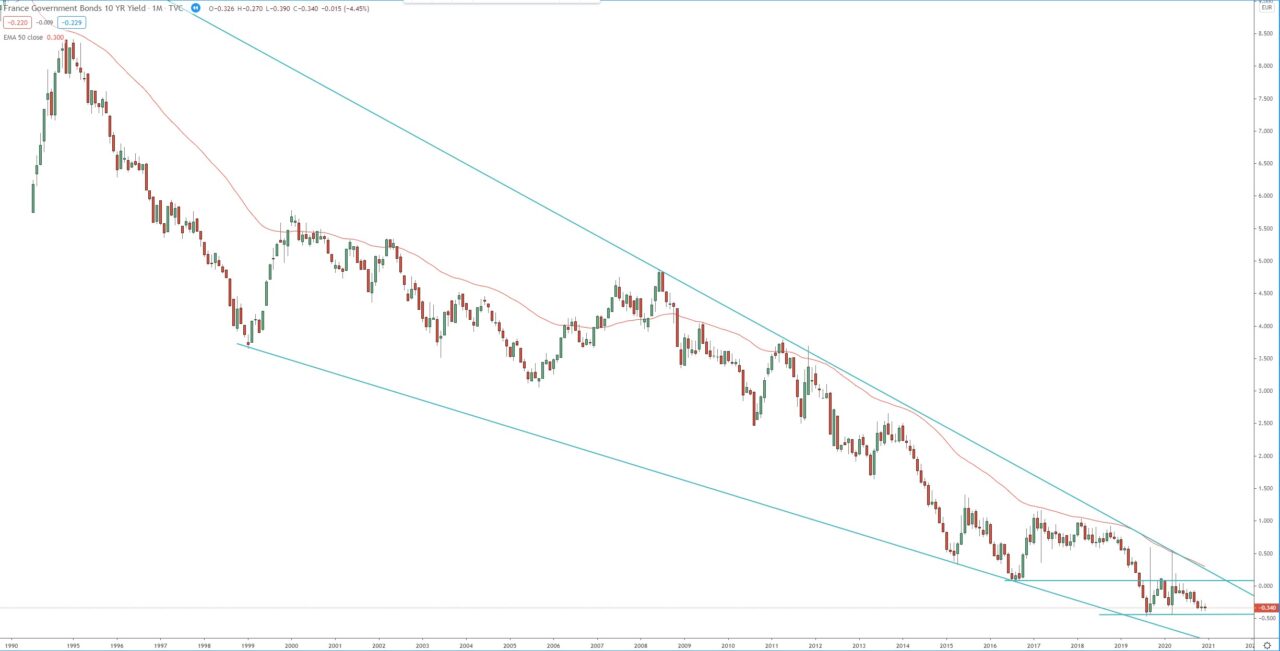
Looking at the monthly chart, we can see that the yield reached and exceeded the 1st target of the 3rd bearish wave at 1.272 FIB extension around +0.640, at the beginning of 2015. That bearish trend continued and in 2018 the yield reached as low as -0.470.
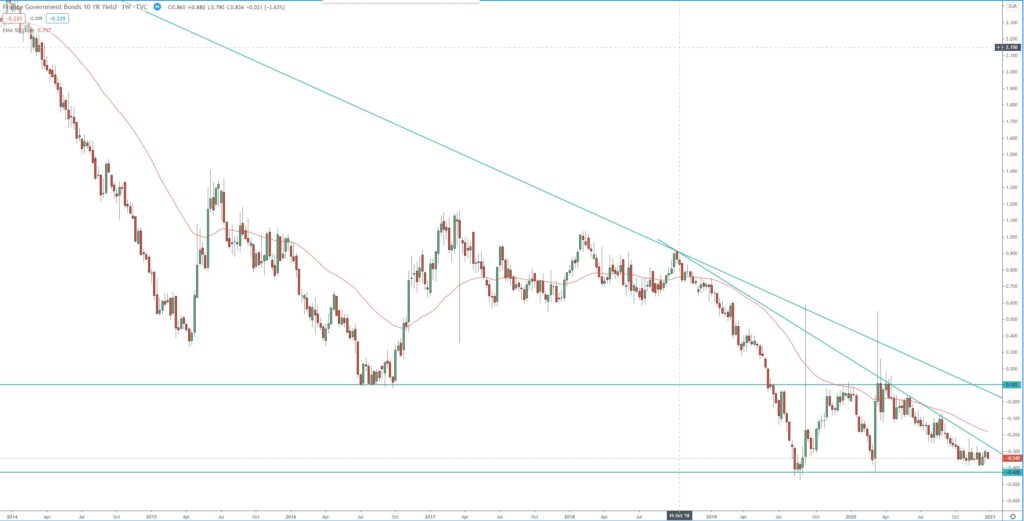
Despite the plunge at the beginning of the COV19 pandemic in 2020, the yield was not able to break below that 2019 low, and formed a double bottom on the monthly and weekly charts. Since then, the price is stuck in a range between -0430-0.125. We need to see a breakout of this range to determine what is next to come.
Monthly chart:

Weekly chart:


