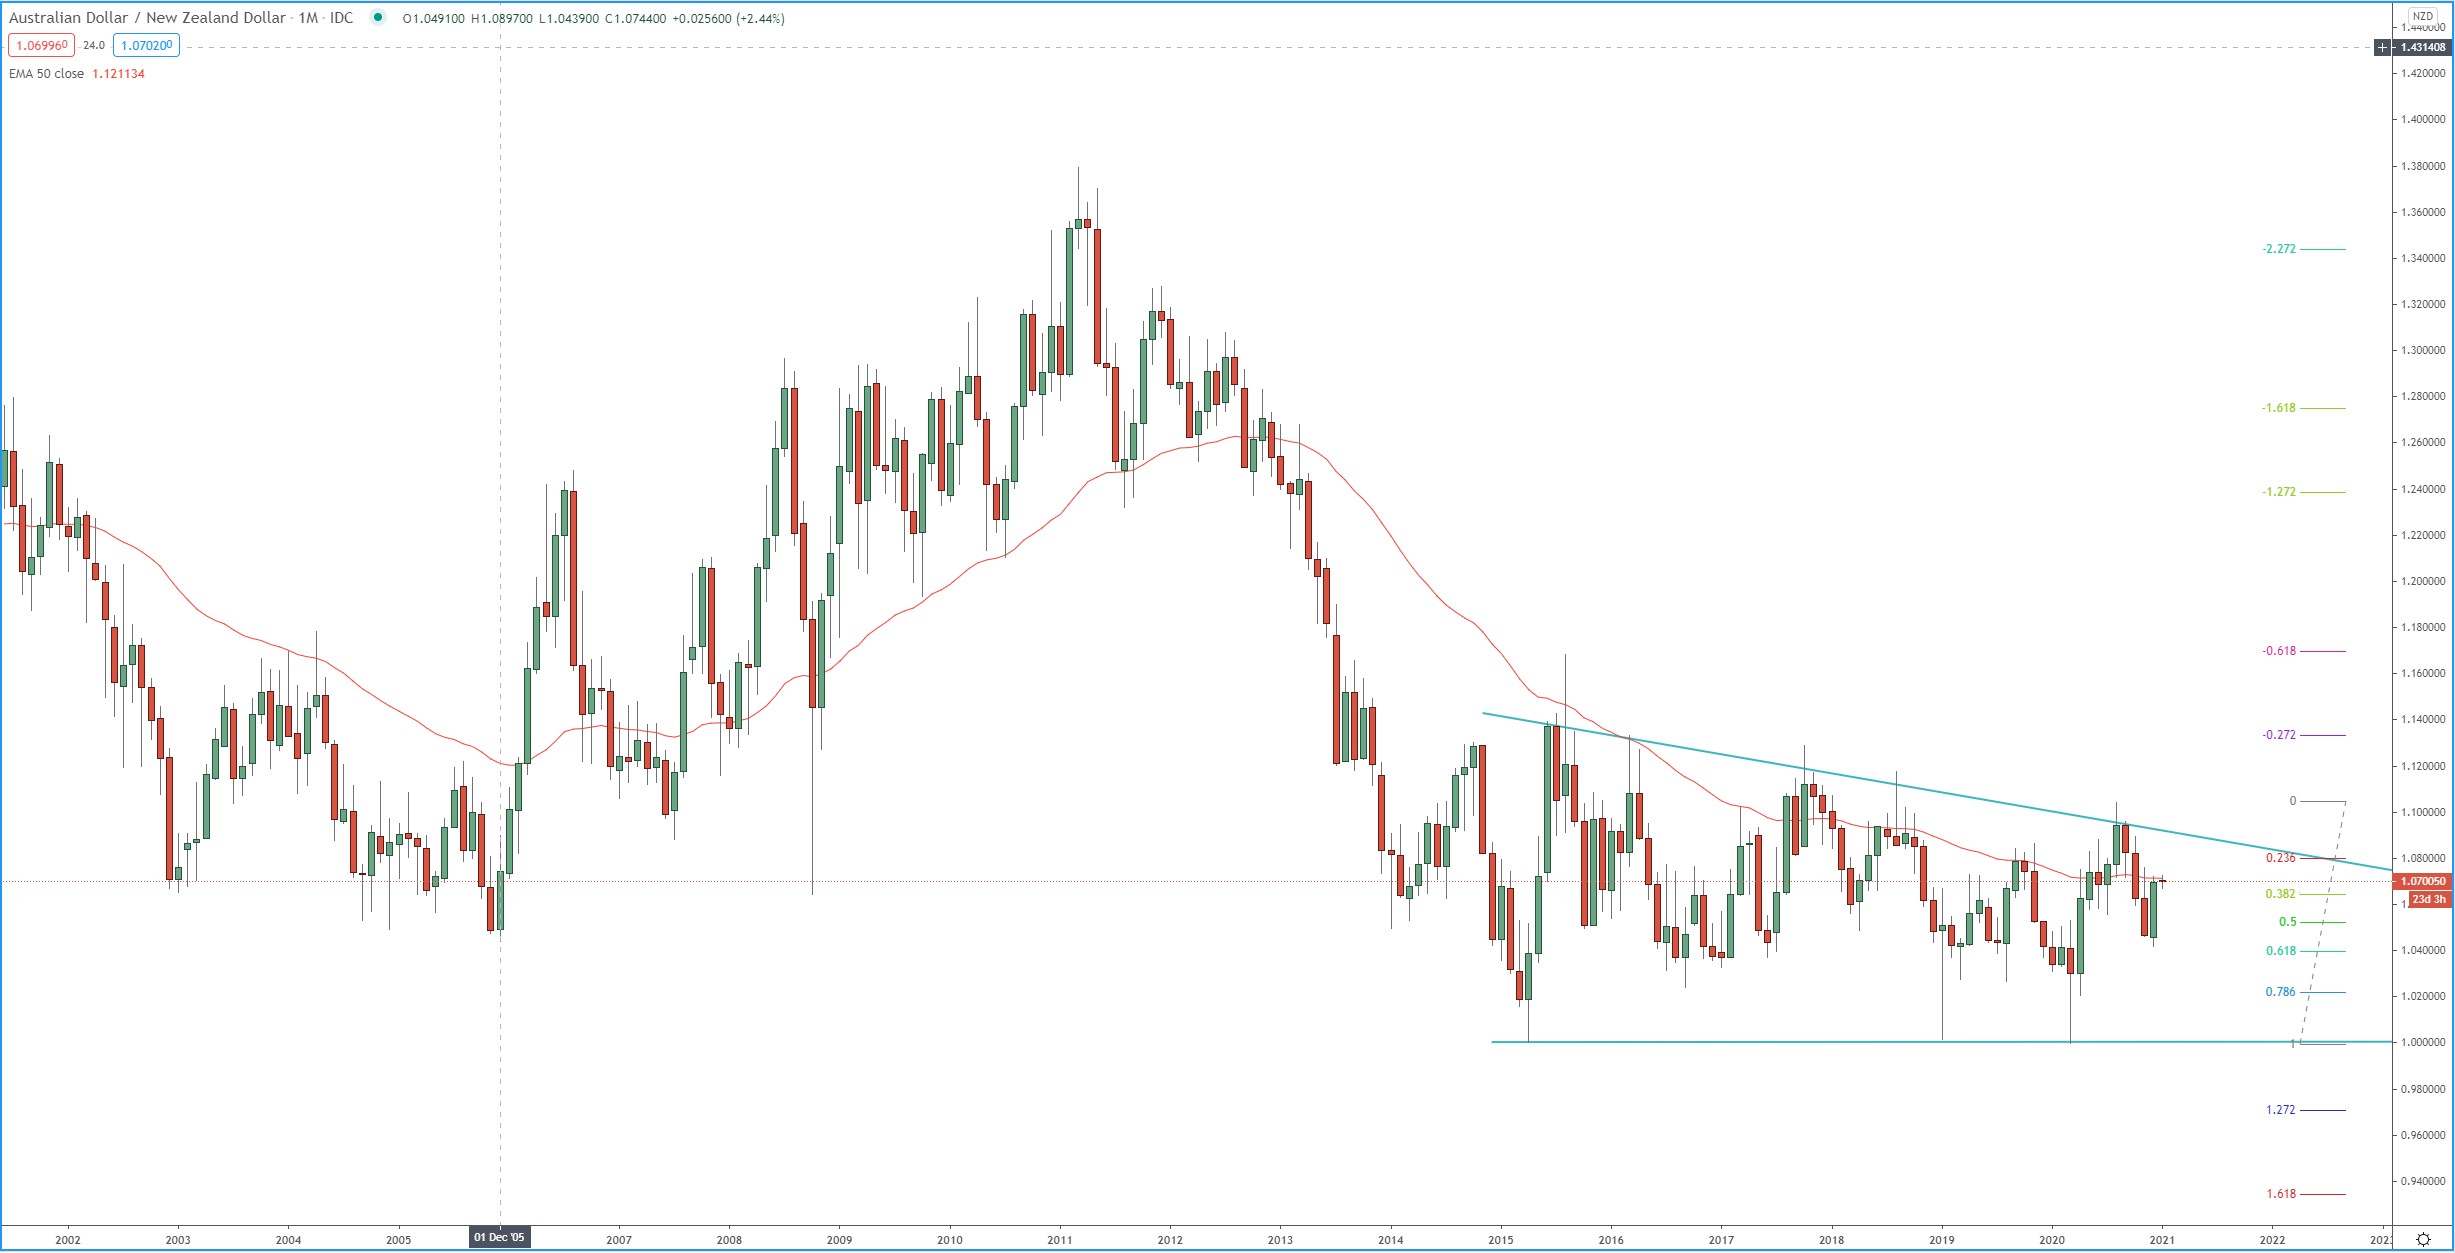
The price is stuck in a pattern on the monthly chart, we need to see breakout of the pattern to determined where the price is heading next. The support level between 1.0280 – 1.0350 may provide bounces and runs to the upside if rejected.
Monthly chart: