|
Getting your Trinity Audio player ready...
|
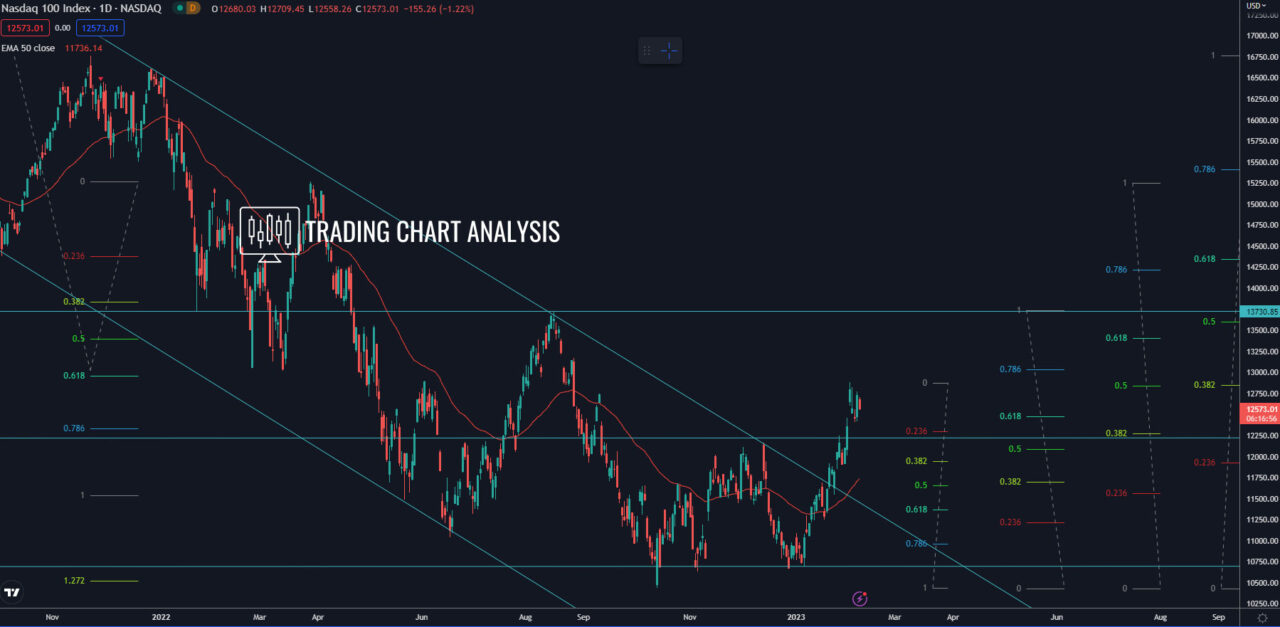
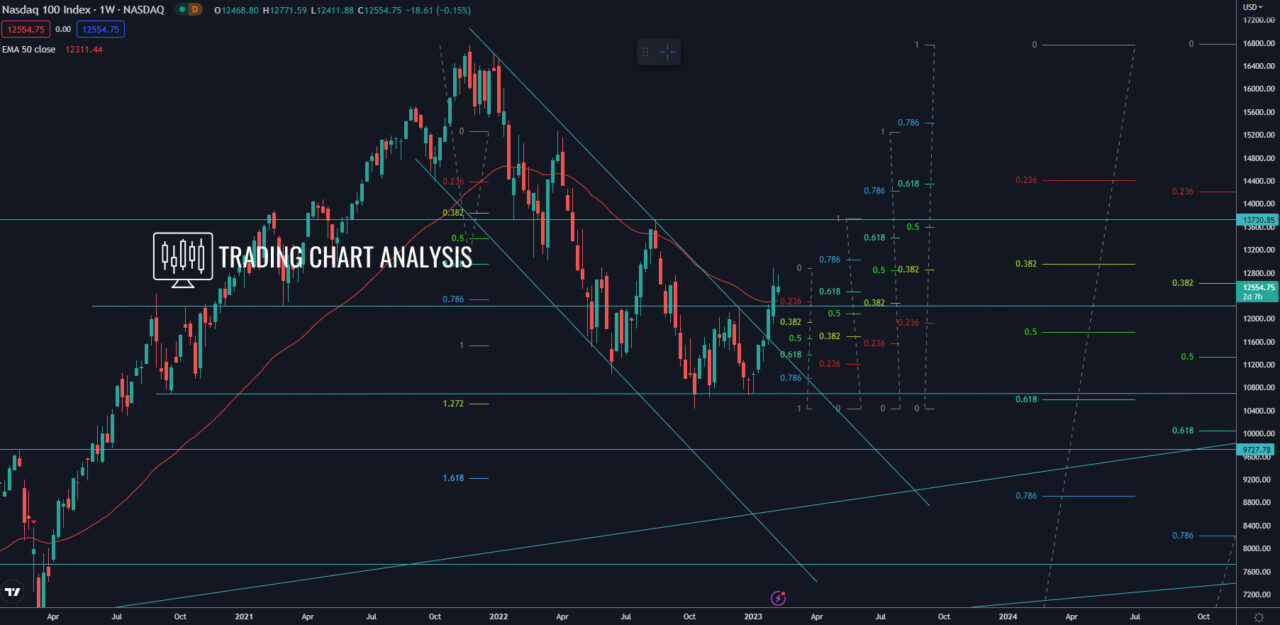
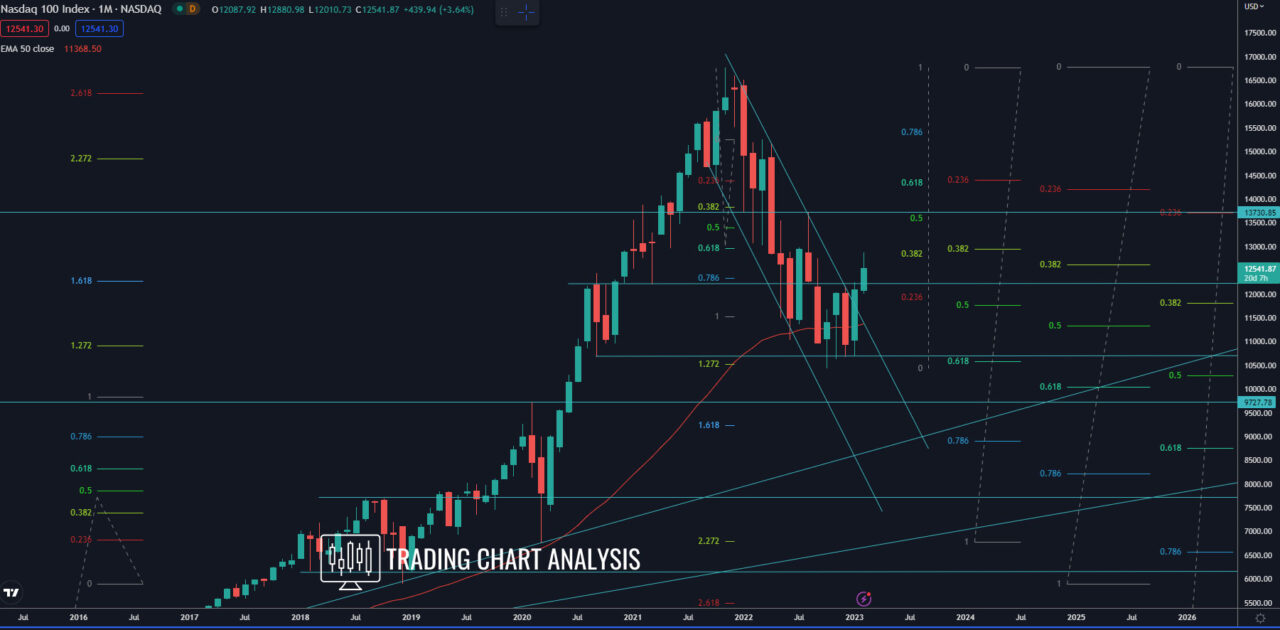
Technical analysis for NASDAQ 100, the index reached the first target of the bearish wave on the weekly chart, the 1.272 FIB extension at 10 500, which is also a 0.618 FIB retracement on the weekly and monthly charts. The index bounced off that key level and broke above a descending trendline, starting a pullback on both, the weekly and the daily charts. The first target of this pullback, the 0.382 FIB retracement at 12 855 on the weekly chart, was reached. The second target for the pullback in the NASDAQ index is the 0.500 FIB retracement on the weekly chart at 13 600. And the third is the 0.618 FIB retracement on the weekly chart at 14 350.
On the other hand, if the NASDAQ 100 breaks below the double bottom and support zone between the 10 671 and 10 440, that will resume the bearish wave on the weekly chart and send the index lower. The first target for such a bearish development is the 1.618 FIB extension on the weekly chart around 9200. And just below 9200, we have the 0.618 FIB retracement on the monthly chart at 8750. In the worst-case scenario, the third target for the bearish wave for NASDAQ 100 on the weekly chart is the 2.272 FIB extension around 6800, which is just above the 2020 low.
Daily chart:

Weekly chart:

Monthly chart:


