|
Getting your Trinity Audio player ready...
|
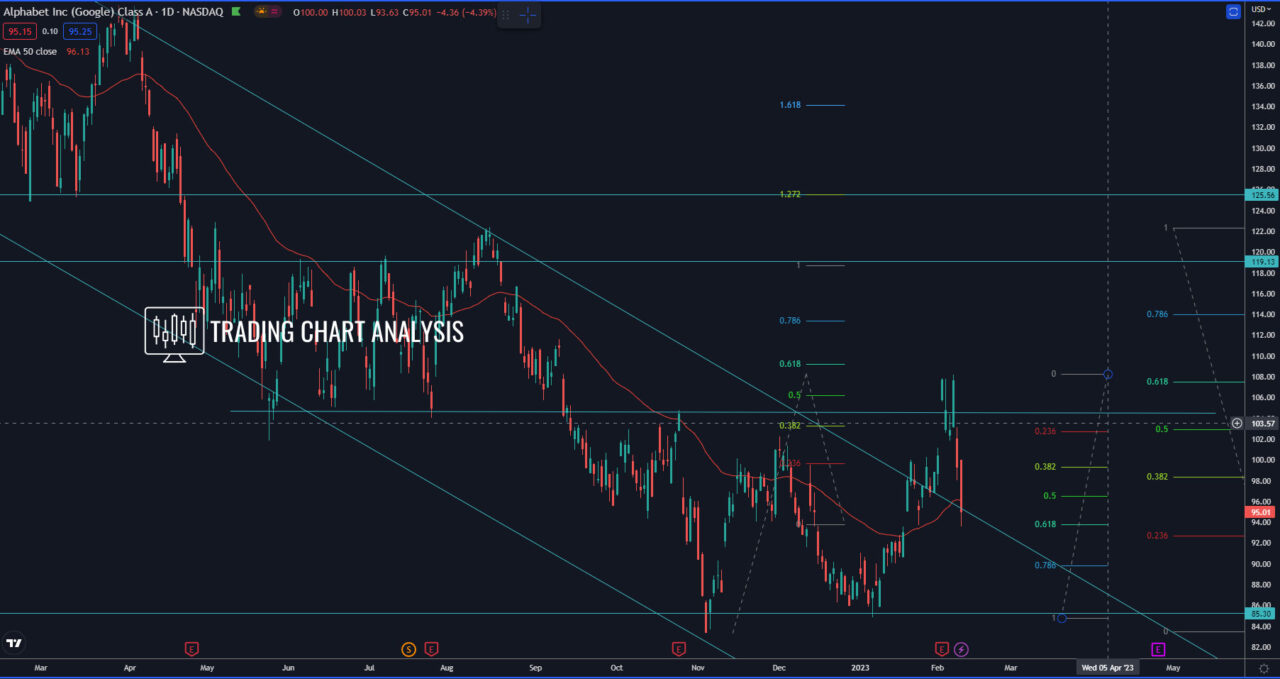
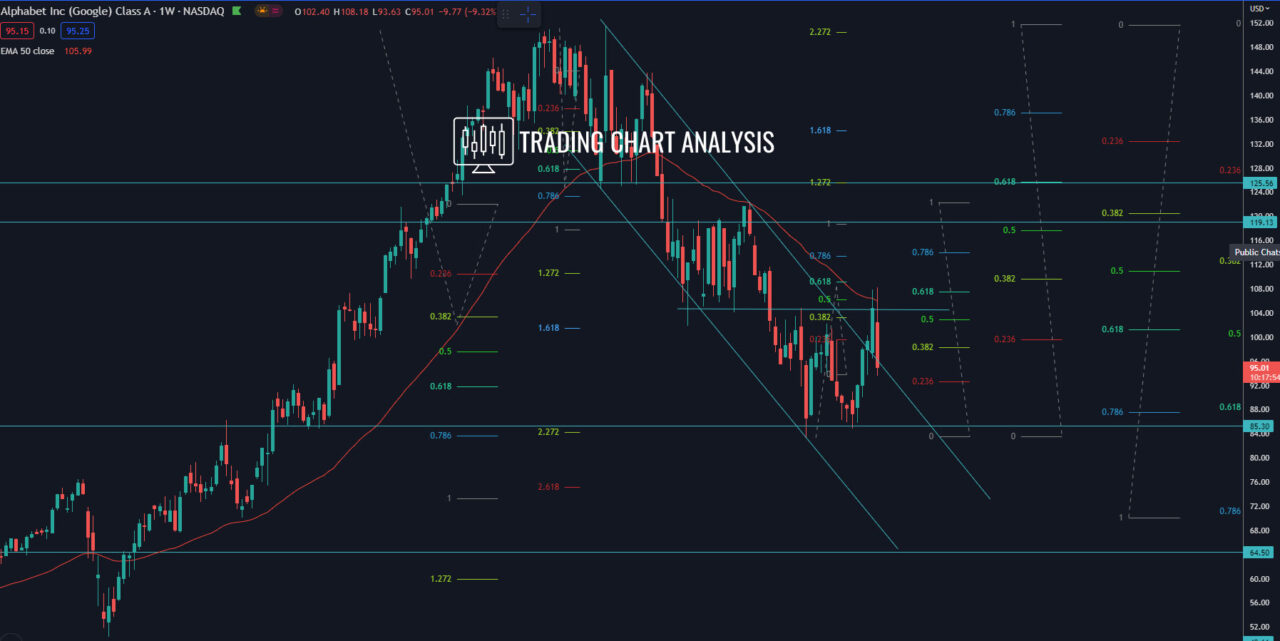
Alphabet Inc (Google) technical analysis, as we pointed out in our previous analysis, the shares of Alphabet reached the third target of the bearish wave on the weekly chart, the 2.272 FIB extension at 84.30$, which was also a support zone and 0.618 FIB retracement on the monthly chart. The price bounced off that support zone and started a pullback, which eventually turned into a breakout on the daily chart.
This breakout of the shares of Google was a break above a descending price channel on the daily chart. The first target for the breakout on the daily chart and pullback on the monthly chart is the 0.382 FIB retracement at 109.50$. Just below that level, we have the 0.618 FIB retracement on the weekly and the daily chart at 107.50$. The shares of Alphabet Inc went as high as 108.18$ and rejected that resistance zone between 107,50$ and 109.50$. This rejection started a pullback on the daily chart, and the first target of this pullback, the 0.618 FIB retracement at 93.80$, was reached.
Now the price retesting the previously broken price channel on the daily chart, a break below 93.00$ will open the door for further declines toward the previous low and support zone between 86.00$ and 83.34$. And a break, below the 83.34$, will resume and extend the bearish wave on the weekly chart and send the shares of Alphabet Inc (Google) lower. The first target for such a bearish development is the 2.618 FIB extension on the weekly chart at 75.00$. The second target is the 0.786 FIB retracement on the monthly chart at 71.00$. And the third target is the 1.272 FIB extension on the monthly chart at 60.00$.
On the other hand, if the shares of Alphabet Inc (Google) break above the zone between109.50$ – 110.00$, that will extend the pullback on the weekly chart and continue the breakout on the daily chart. The first target for such a bullish development is the 0.500 FIB retracement on the weekly and monthly charts at 117.60$. The second target is the 1.272 FIB extension on the daily chart, which is a 0.618 FIB retracement on the weekly and monthly charts at 125.50 and within a strong resistance.
Daily chart:

Weekly chart:


