|
Getting your Trinity Audio player ready...
|
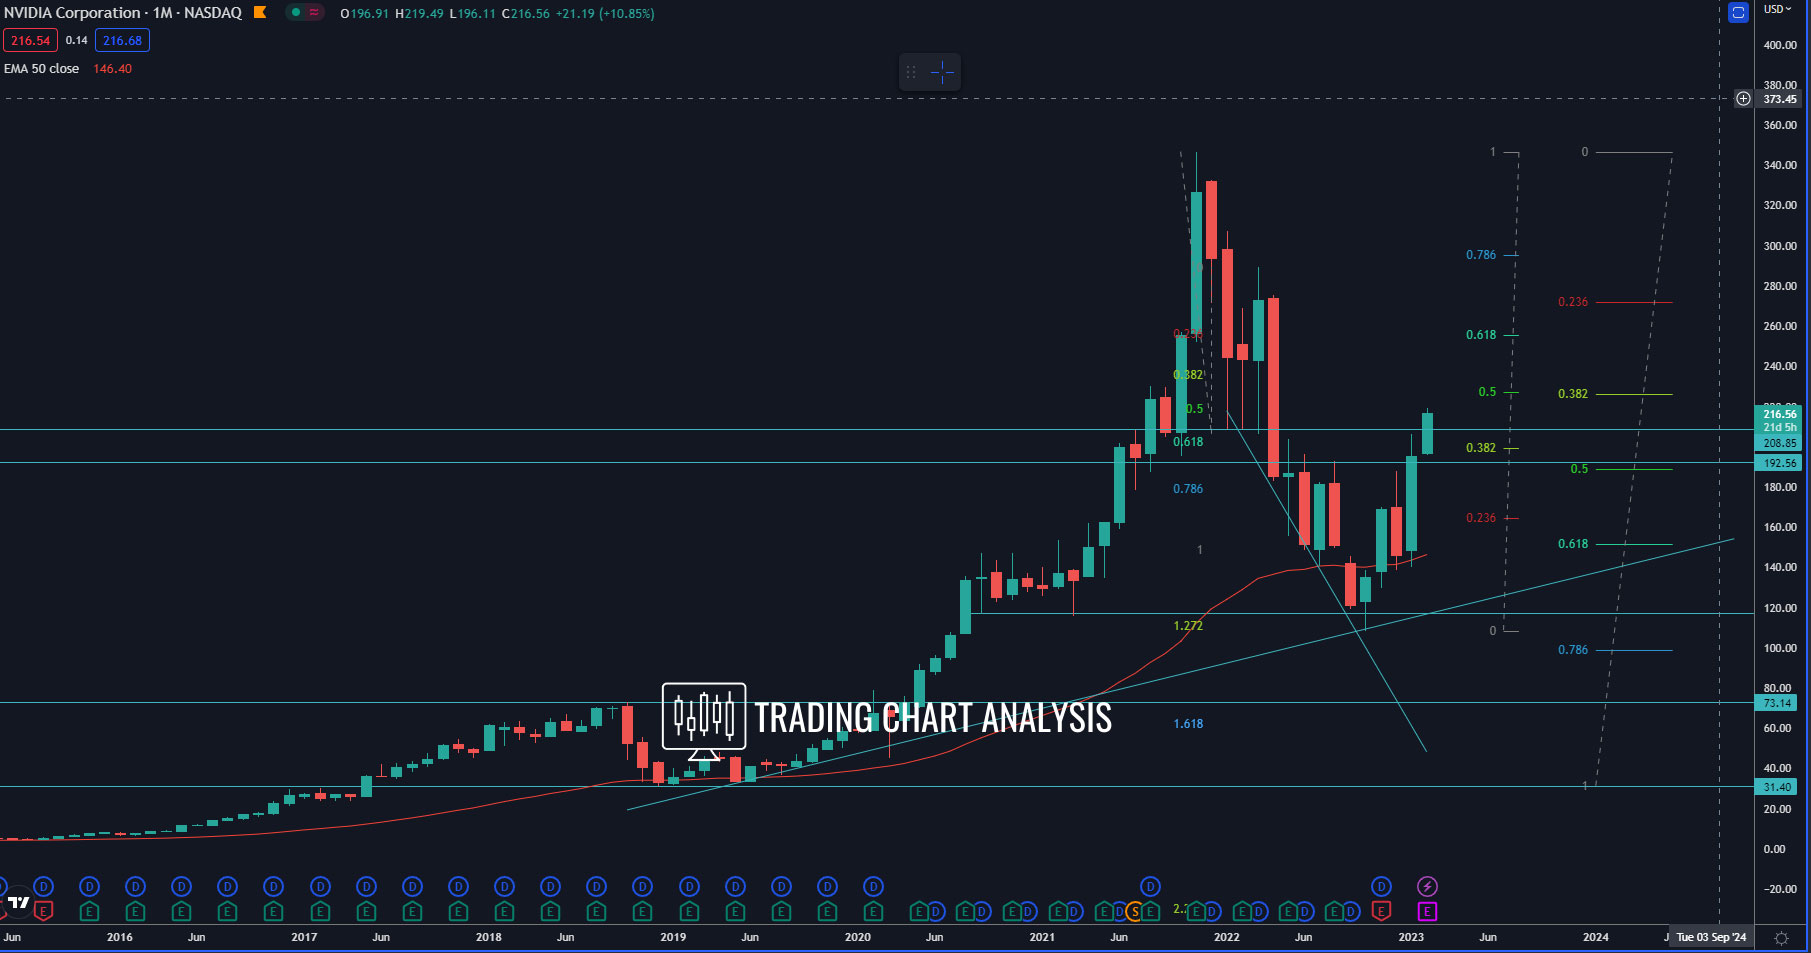
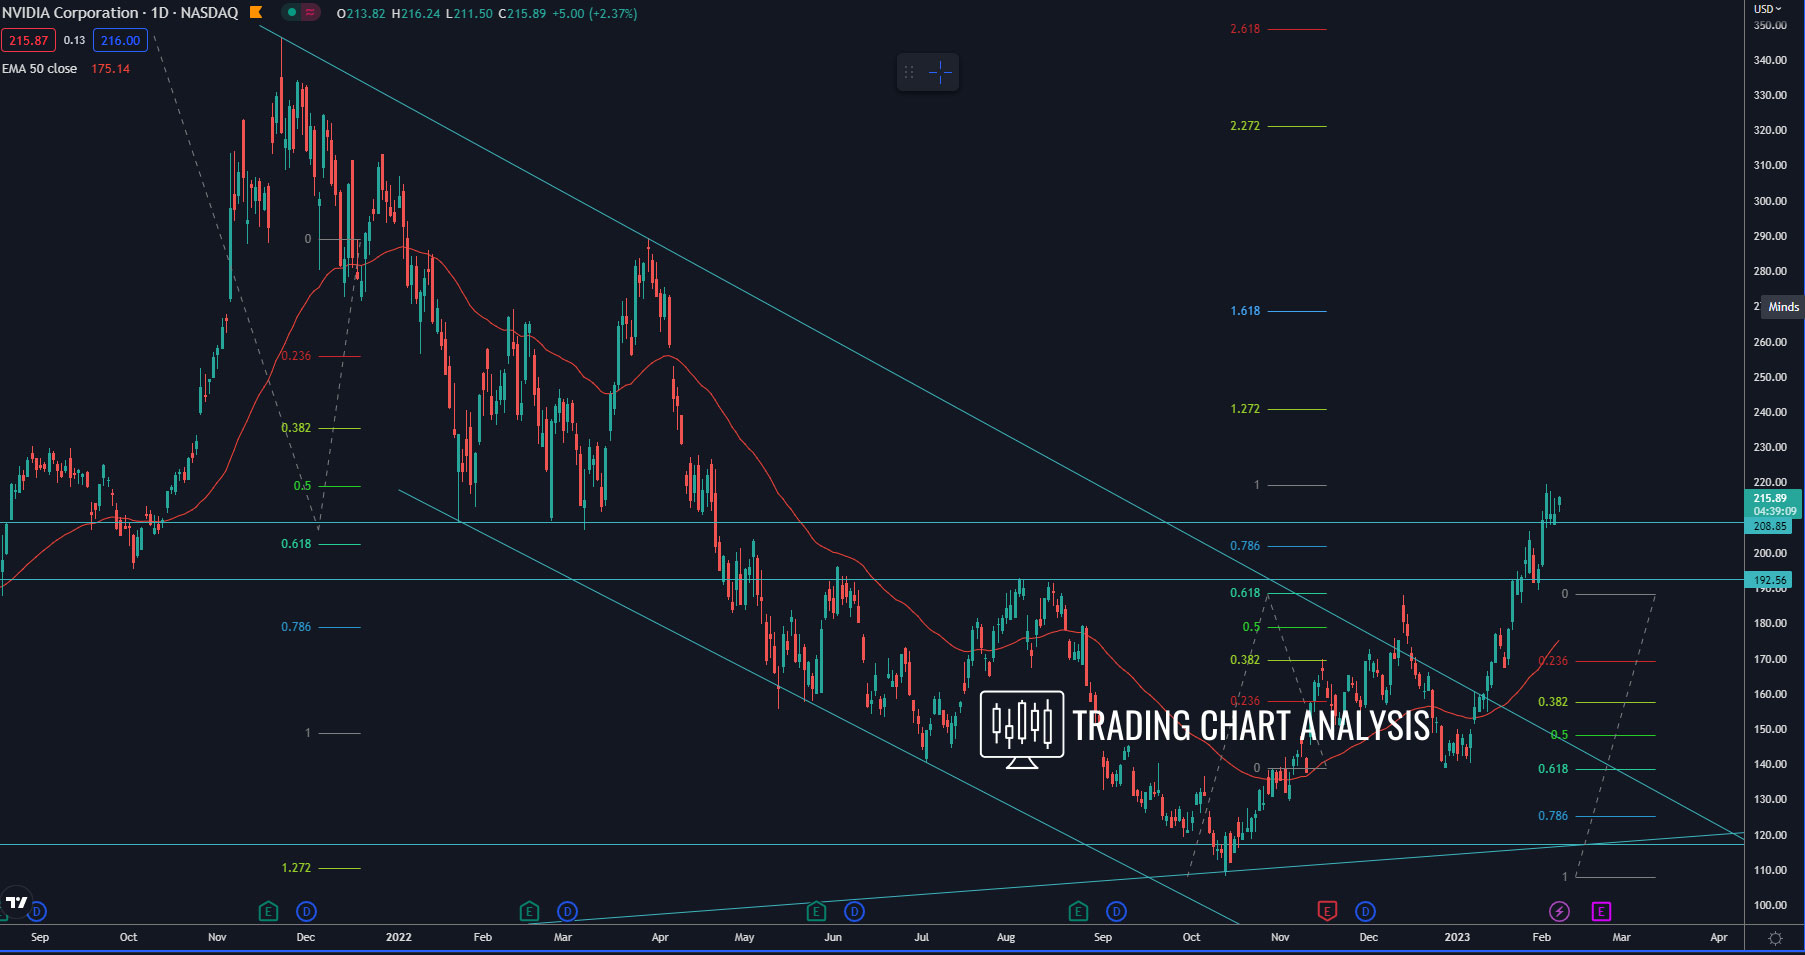
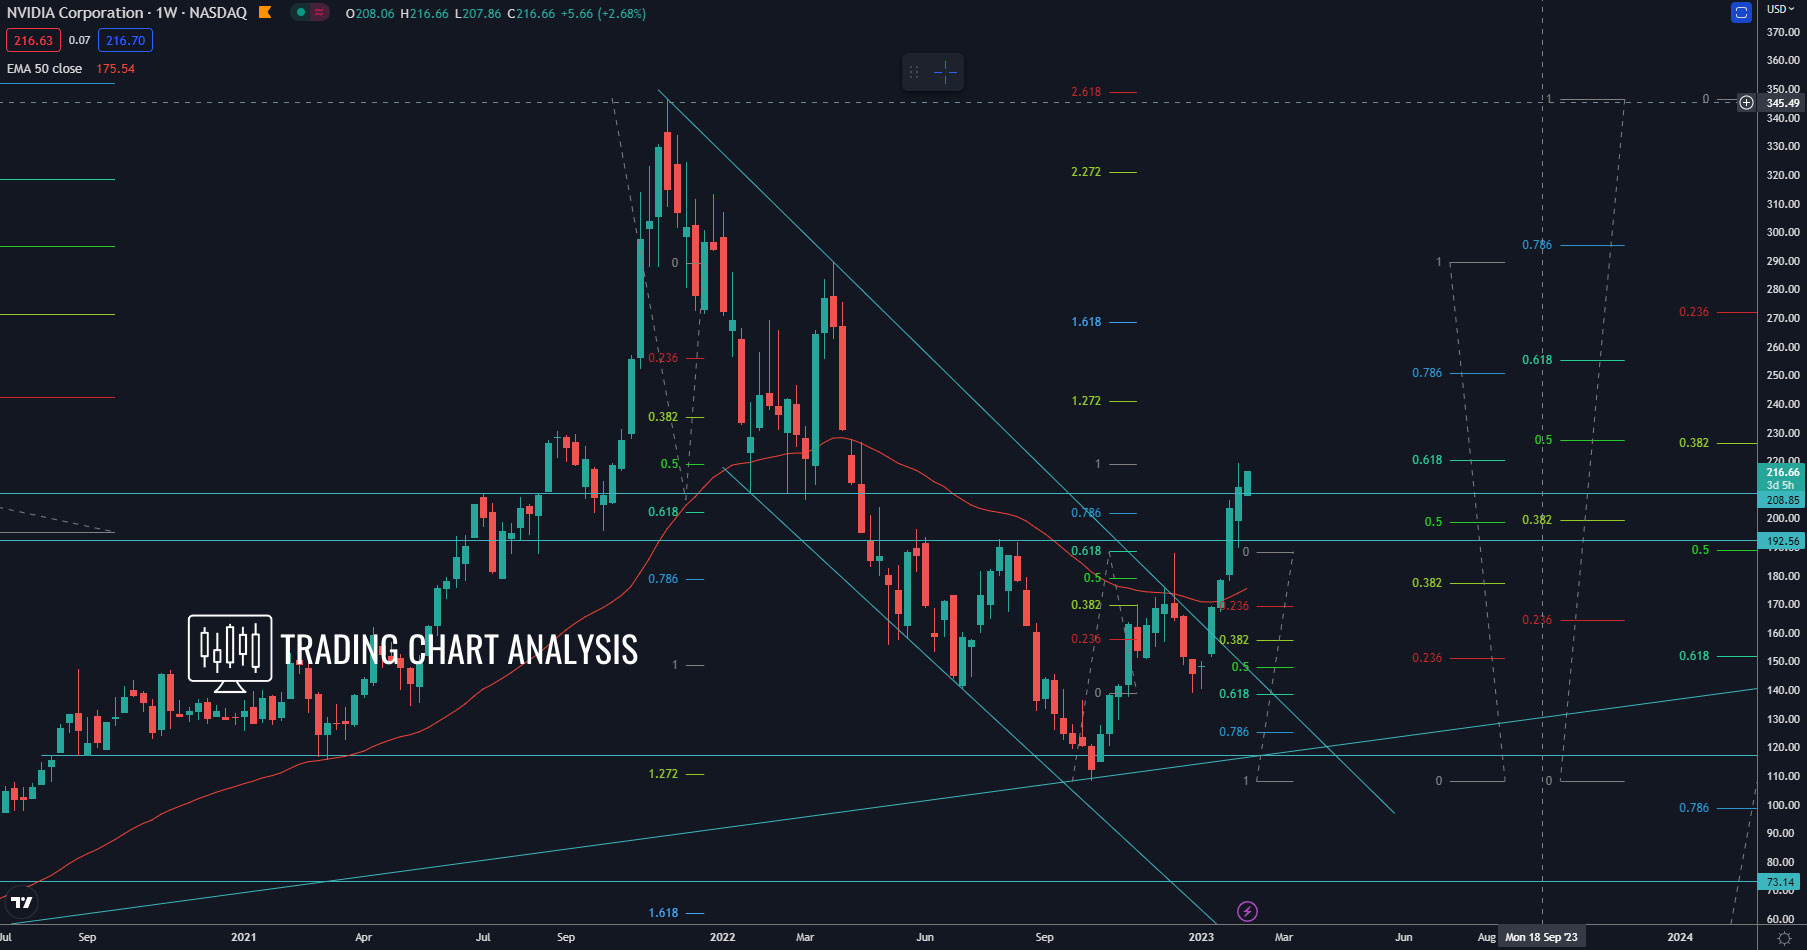
Technical analysis for Nvidia, the price of the shares reached the first target of the bearish wave on the weekly chart, the 1.272 FIB extension at 110.00$. Around that level, we had both horizontal and dynamic support on the weekly and daily charts. The bounce turned into a full breakout with a reversal Head & Shoulders pattern on the weekly chart.
The first target for the bullish breakout in the shares of Nvidia CORP is the 1.272 FIB extension on the daily chart at 141$. The second target is 0.618 FIB retracement on the weekly chart at 255$. The third target is the 1.618 FIB extension on the daily chart at 268$. The fifth and the sixt targets are the 2.272 and the 2.618 FIB extension at 321$ and respectively 348$.
On the other hand, a break back below 150$ will be a signal for further declines toward the previous low at 138.84$. And a break below the previous weekly low at 138.84$ will be a signal for the resumption of the bearish wave on the weekly chart for the shares of Nvidia. The first target for such a bearish development in the shares of Nvidia is low at 108.13$. The second target is the 1.618 FIB extension at 62$.
Daily chart:
Weekly chart:
Monthly chart: