|
Getting your Trinity Audio player ready...
|
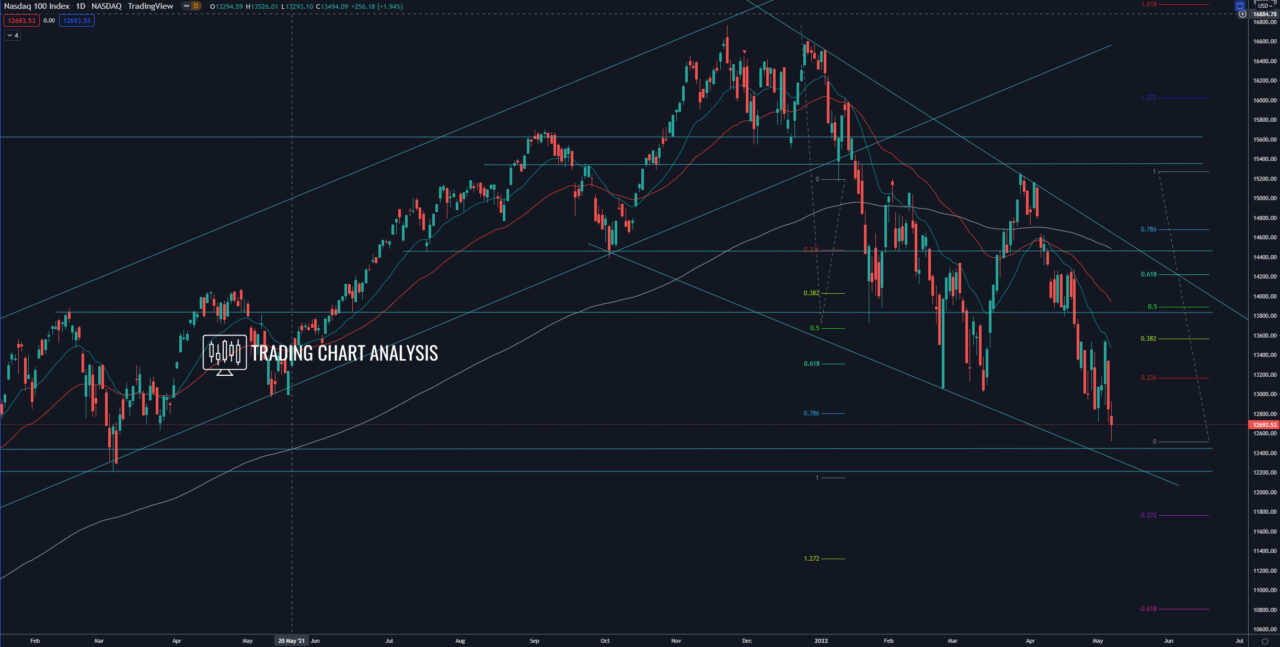
Technical analysis for NASDAQ, the index is approaching a support zone between 12 450 and 12 208, within that zone, we also have dynamic support. That could be enough to start a pullback on the NASDAQ 100. The first target for this potential pullback is the previous daily high at 13 556. The second target is the resistance zone between 14 270 – 14 450.
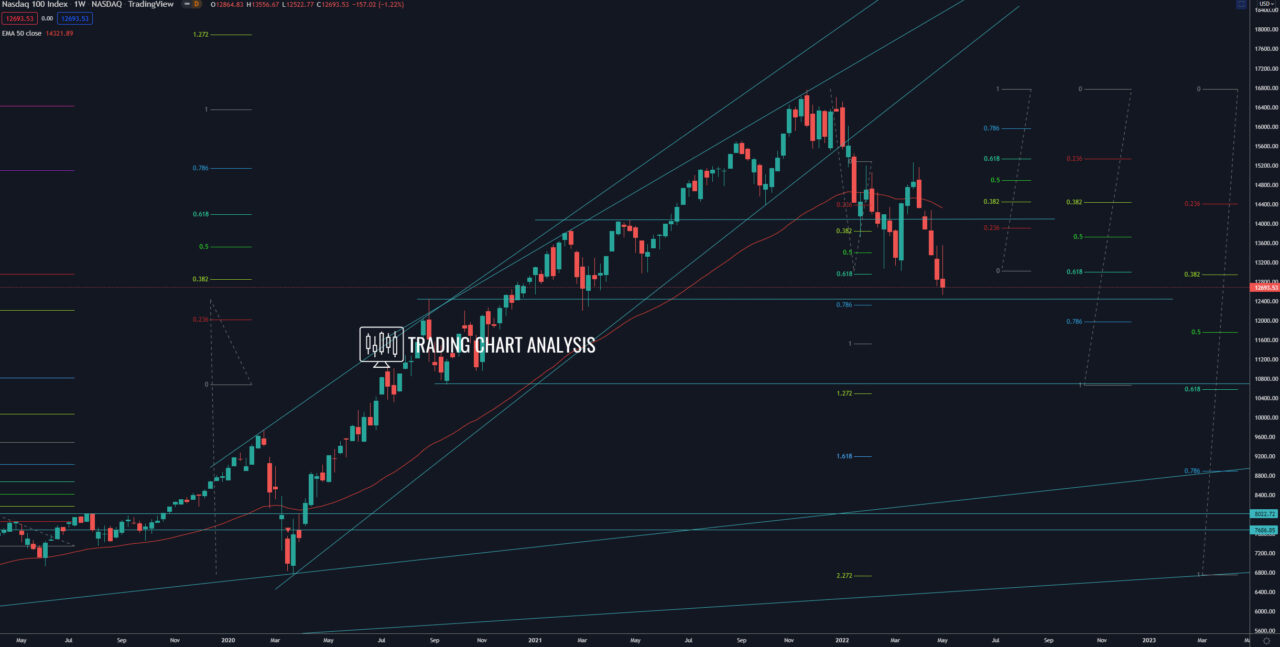
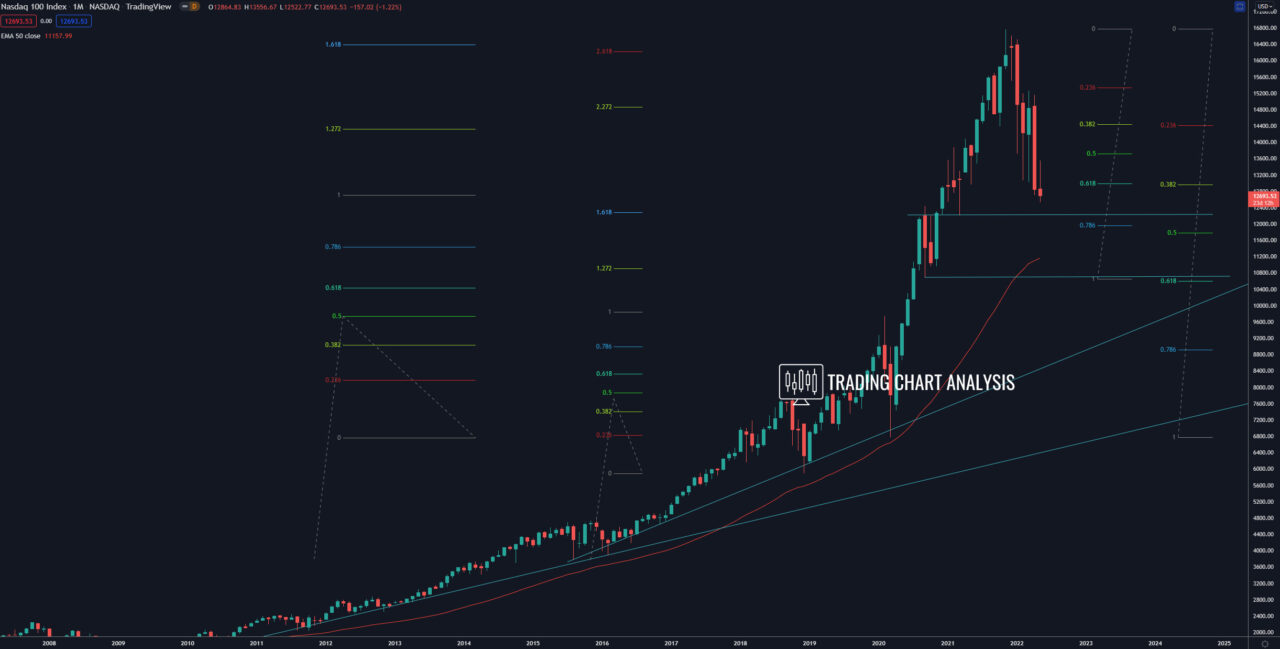
Looking at the bigger picture, NASDAQ closed below the 0.618 FIB retracement on the weekly chart, below the 0.382 FIB on the monthly chart at around 12 960, and below the double bottom on the daily chart at around 13 065. This breakout opened the door for a bearish run toward the 0.618 FIB retracement on the monthly chart at 10 600, just above the 1.272 FIB extension on the weekly chart at 10 500. The NASDAQ index is on its way toward that zone, which is a target for the bearish wave on the weekly chart.
Daily chart:

Weekly chart:

Monthly chart:


