|
Getting your Trinity Audio player ready...
|
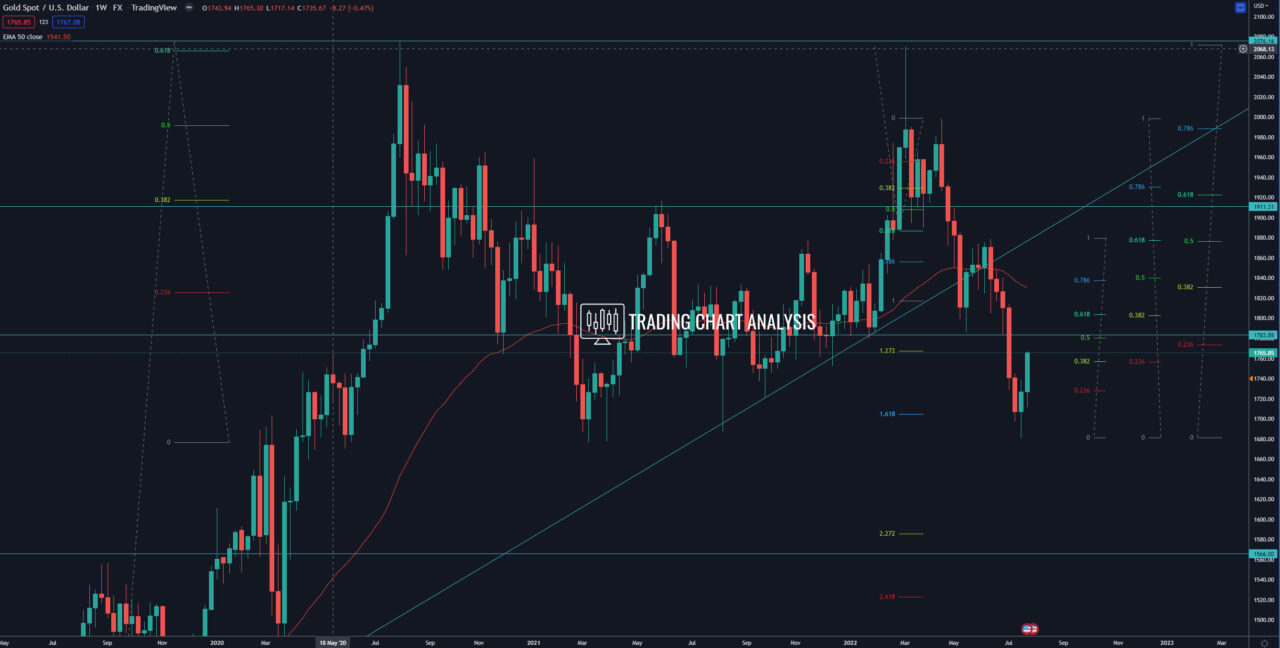
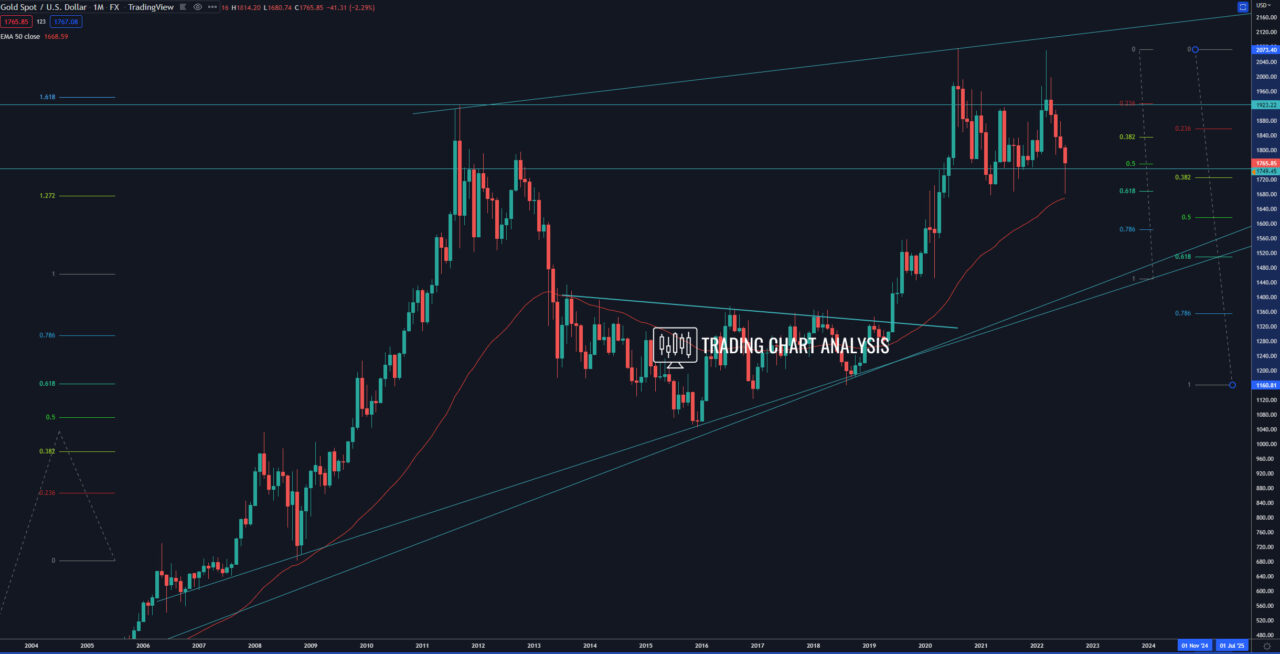
Technical analysis for Gold(XAU/USD), the price bounced from support, and the 0.618 FIB retracement on the monthly chart at 1680-90, starting a pullback. The first target for the pullback, the 0.382 FIB retracement on the weekly chart at 1757, was reached. The second target is the 1.272 FIB extension on the four-hour chart at 1785, which is is also a resistance. The third target is the 0.618 FIB retracement on the weekly chart at 1805, which is a 1.618 FIB extension on the four-hour chart. The fourth target for the pullback in Gold is the 0.382 FIB retracement on the monthly chart at 1830, and the fifth target is the previous weekly high around 1870.
On the other hand, if the price of Gold breaks below the support at 1710, it will open the door for a bearish run for a retest of the low at 1680. And a close below 1680 on the weekly chart will signal further declines toward, first, the 0.786 FIB retracement on the monthly chart at 1585 and then toward 1500.
Weekly chart:

Monthly chart:


