|
Getting your Trinity Audio player ready...
|
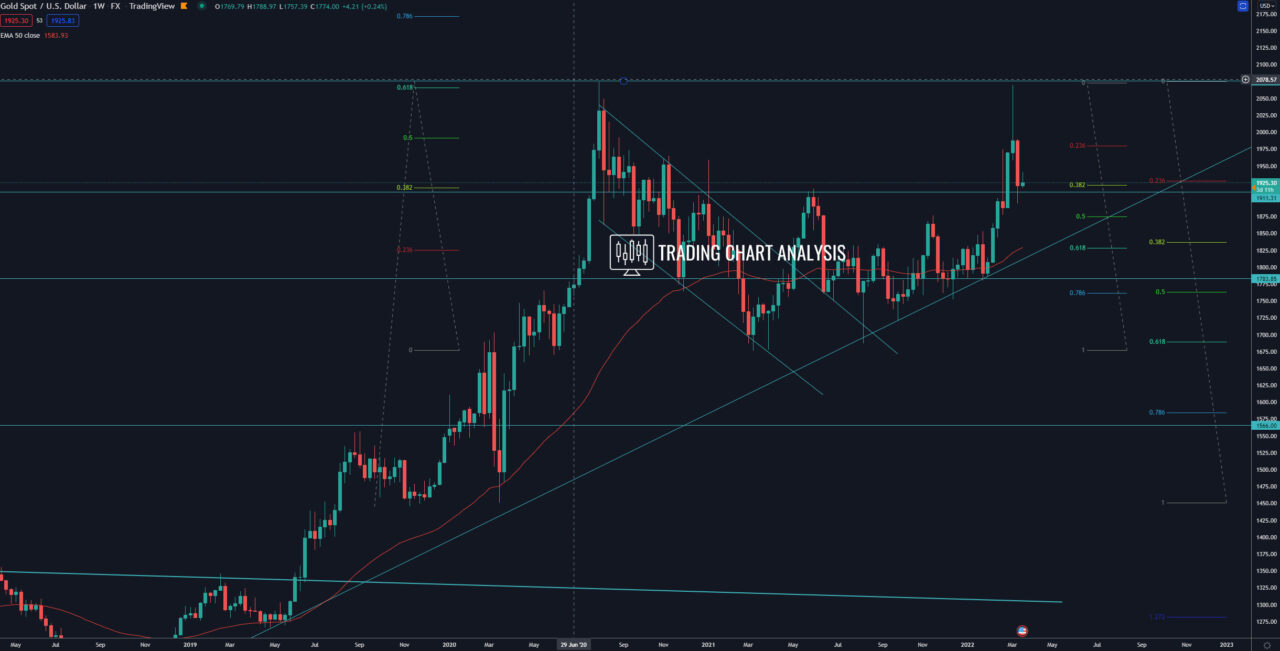
Technical analysis for Gold (XAU/USD), the price reached the second target of the fifth bullish wave on the weekly chart, the 0.618 FIB extension at 2070, and rejected with an evening star pattern on the weekly chart, starting a pullback. The first target for this pullback, the 0.382 FIB retracement on the weekly chart at 1920, was reached. The second target for Gold is the 1.272 FIB extension on the four-hour chart at 1880. The third target is the 1.618 FIB extension on the four-hour chart at 1845. The fourth target is the 0.618 FIB retracement on the weekly chart at 1825. The fifth target is the low and support zone around 1780.
On the other hand, if the price of Gold (XAU/USD) breaks above 0.382 FIB retracement on the daily chart at 1965, it will open the door for a bullish run toward the 0.618 FIB retracement at 2000. And a break above 2000 will open the door for a bullish run toward the previous all-time high at 2075.
Weekly chart:


