|
Getting your Trinity Audio player ready...
|
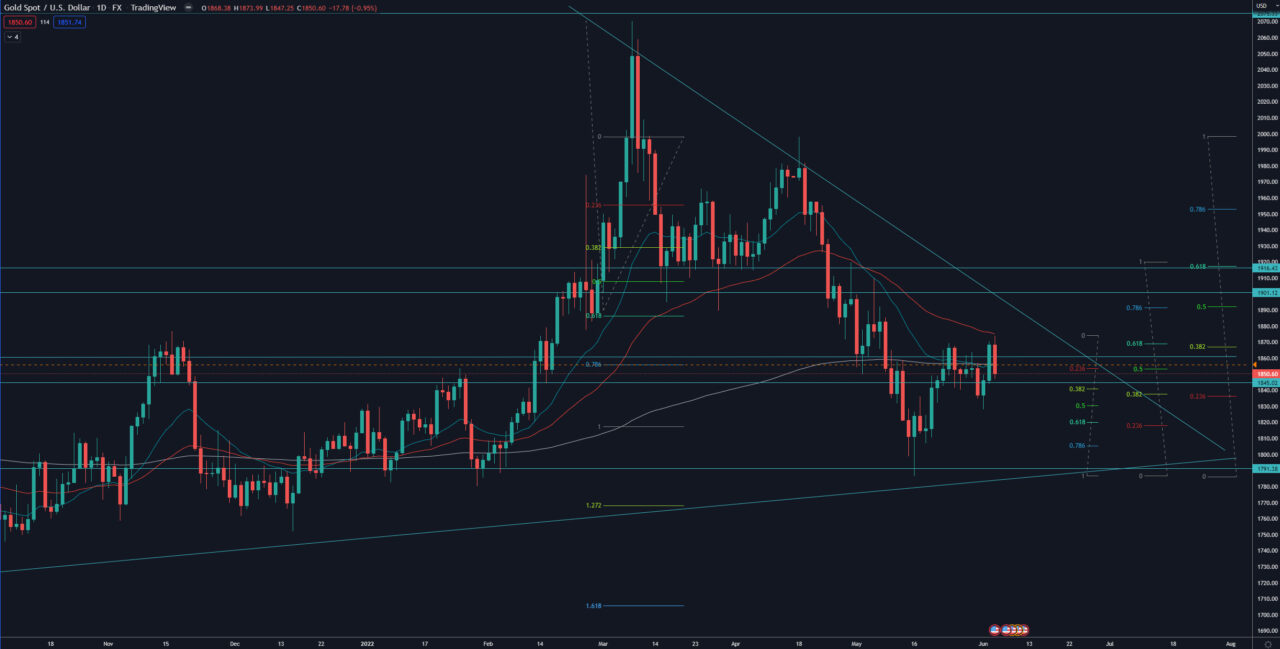
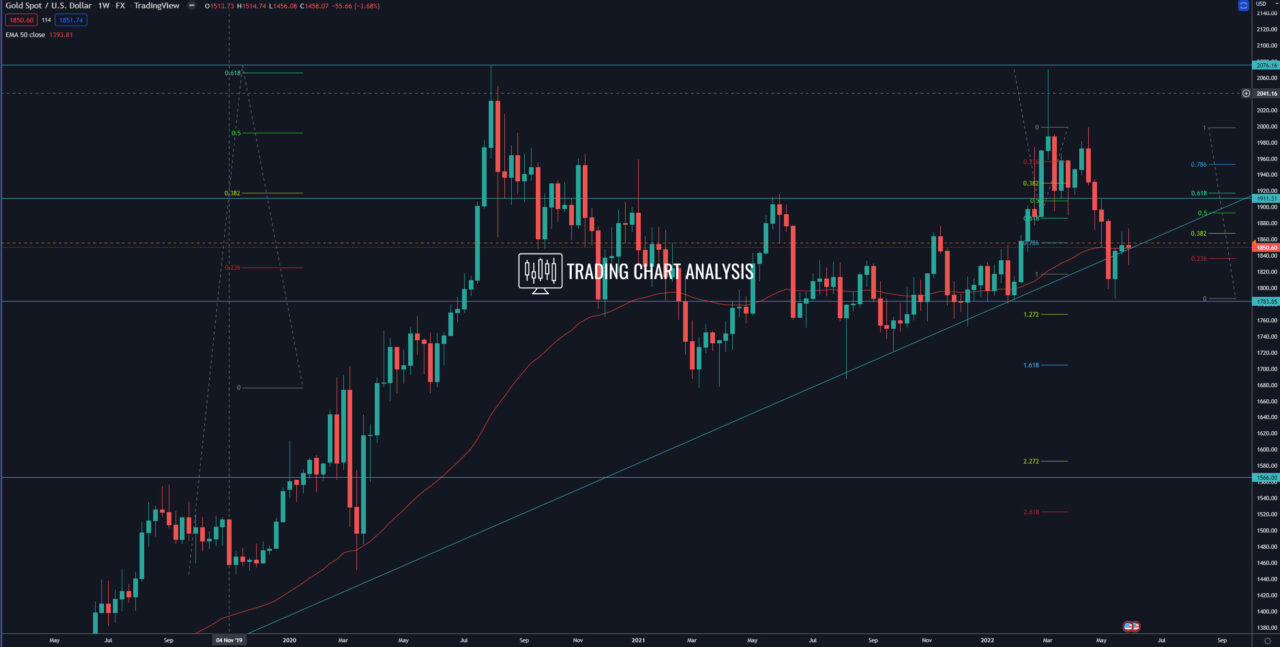
Technical analysis for Gold, the price of XAU/USD formed a tweezers top pattern on the weekly chart, rejecting the weekly and the daily 50 EMAs, the 0.382 FIB retracement on the weekly chart, and the 0.618 FIB retracement on the daily chart, which is a sign of resumption of the bearish run. The first target for this bearish run is the 0.618 FIB retracement on the daily chart at 1820, but before that, we need to see a break below the low from last week at 1828. The second target is the previous low on the weekly chart at 1786.
A break below 1786 will resume the bearish run on the weekly chart, and it will send the price of Gold lower toward, first the 1.272 FIB extension and second toward the 1.618 FIB extension at 1705. The third target is the support and the 0.618 FIB retracement on the monthly chart at 1688.
On the other hand, if the price of Gold breaks above the 0.382 FIB retracement on the weekly chart and above the daily 50 EMA, that will extend the pullback and send the price higher. The first target for this potential bullish run on the daily chart is the resistance zone between 1900 – 1975, where we have the 0.618 FIB retracement on the weekly chart.
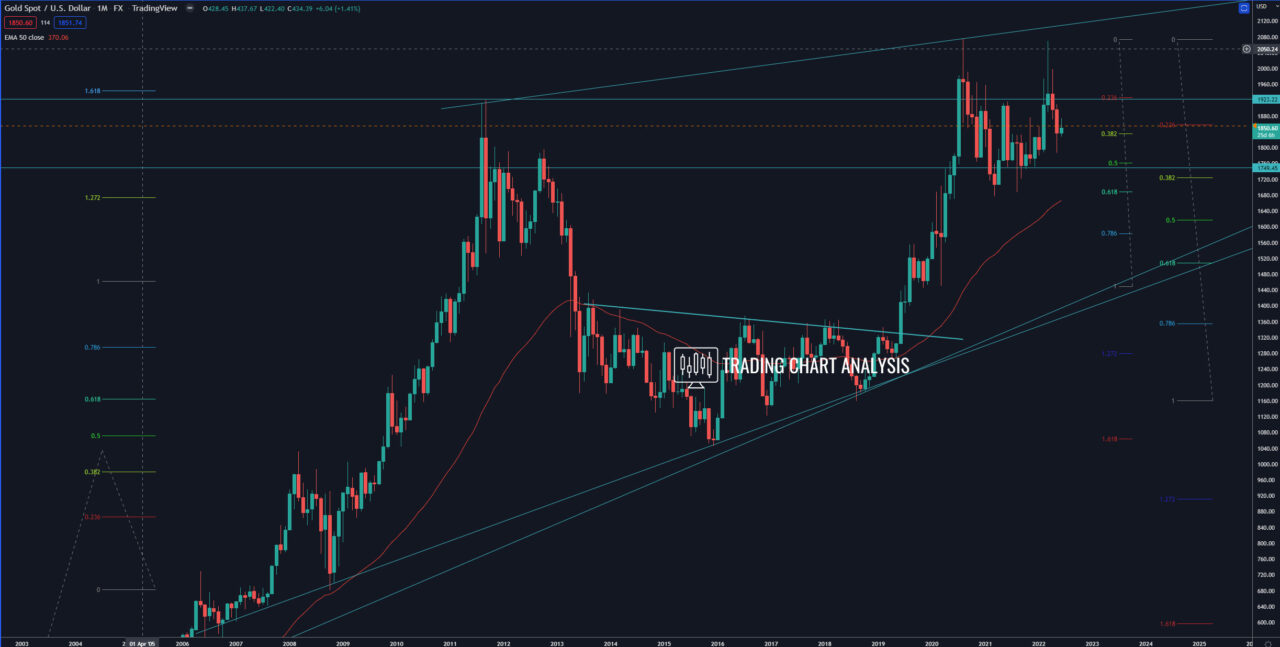
Looking at the bigger picture, the price of Gold reached the second target of the fifth bullish wave on the weekly chart, the 0.618 FIB extension at 2065. The price of XAG/USD went as high as 2074 and formed a double top on both the weekly and the monthly charts. The focus now is on the 0.618 FIB retracement on the monthly chart at 1688, where we have the low on the monthly chart at 1676. A break below 1676 will send the price of Gold tumbling toward the trend line and the 0.618 FIB retracement on the monthly chart around 1500.
Daily chart:

Weekly chart:

Monthly chart:


