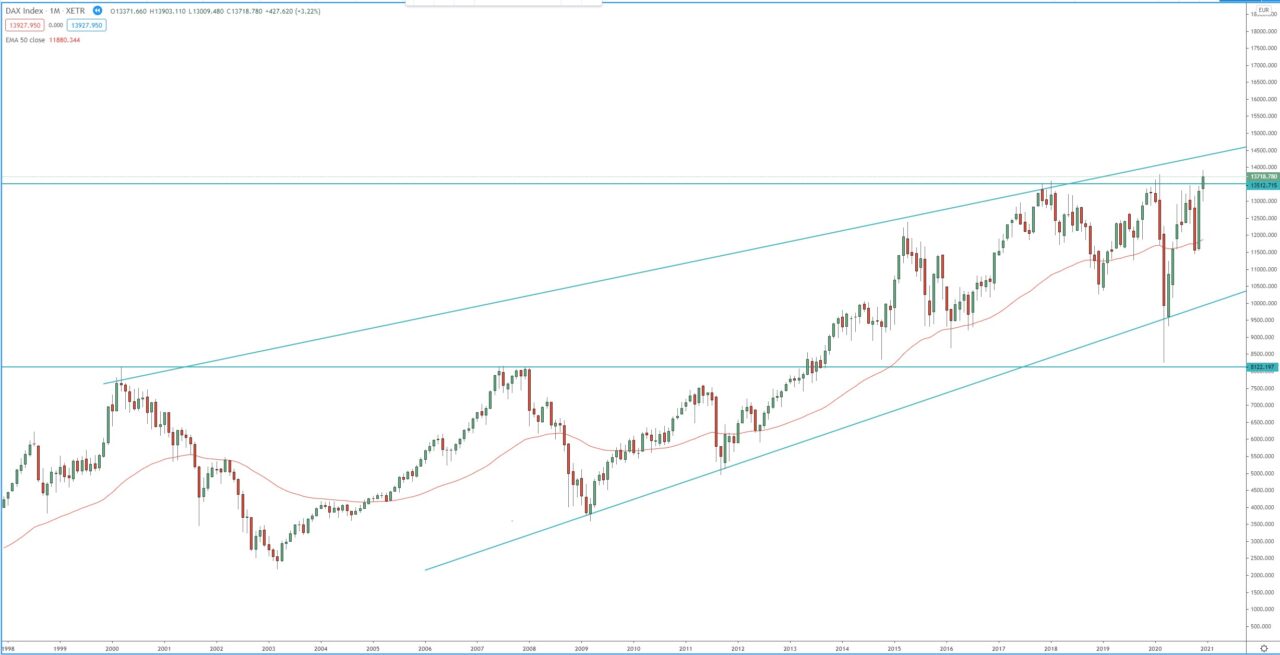
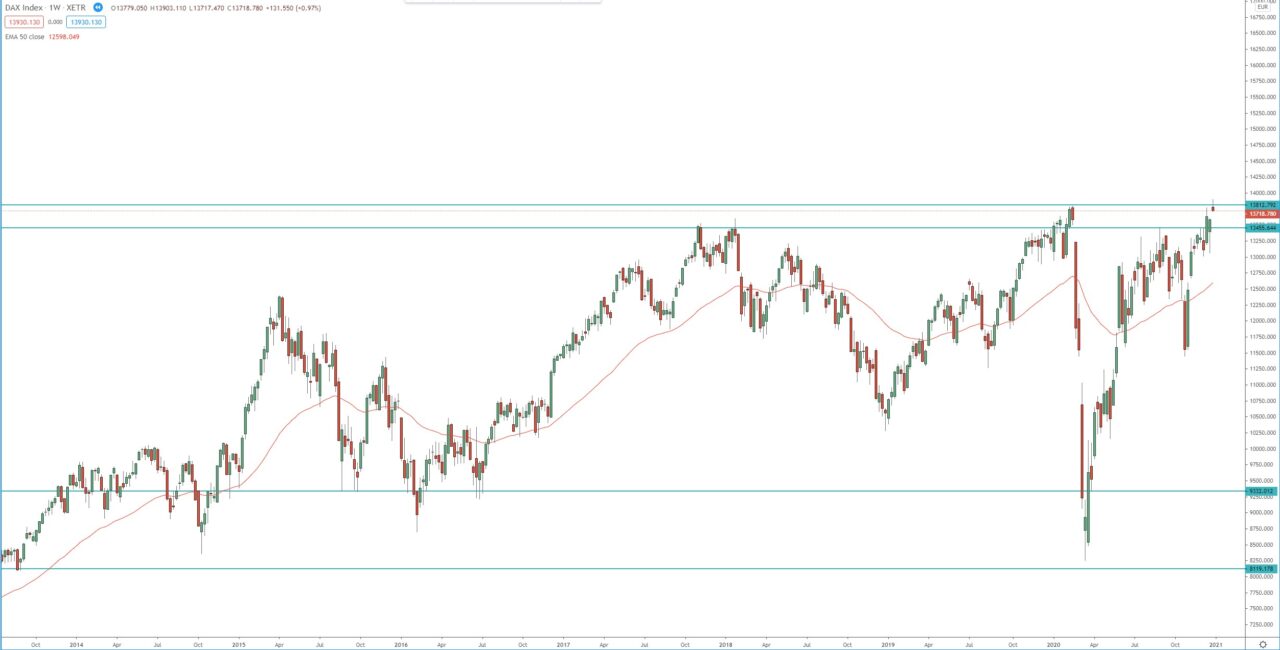
Long-term view, the monthly chart is within its 3rd bullish wave, the first target of this wave is the 1.272 FIB extension around 16 550. However, the price is facing some strong resistance, first the resistance between 2017, 2018 and 2020 highs, between 13 455 – 13 795, and above that is dynamic resistance, top of ascending channel on the monthly chart. We need to see the price breaking firmly above all this resistance, before the next sizable move.
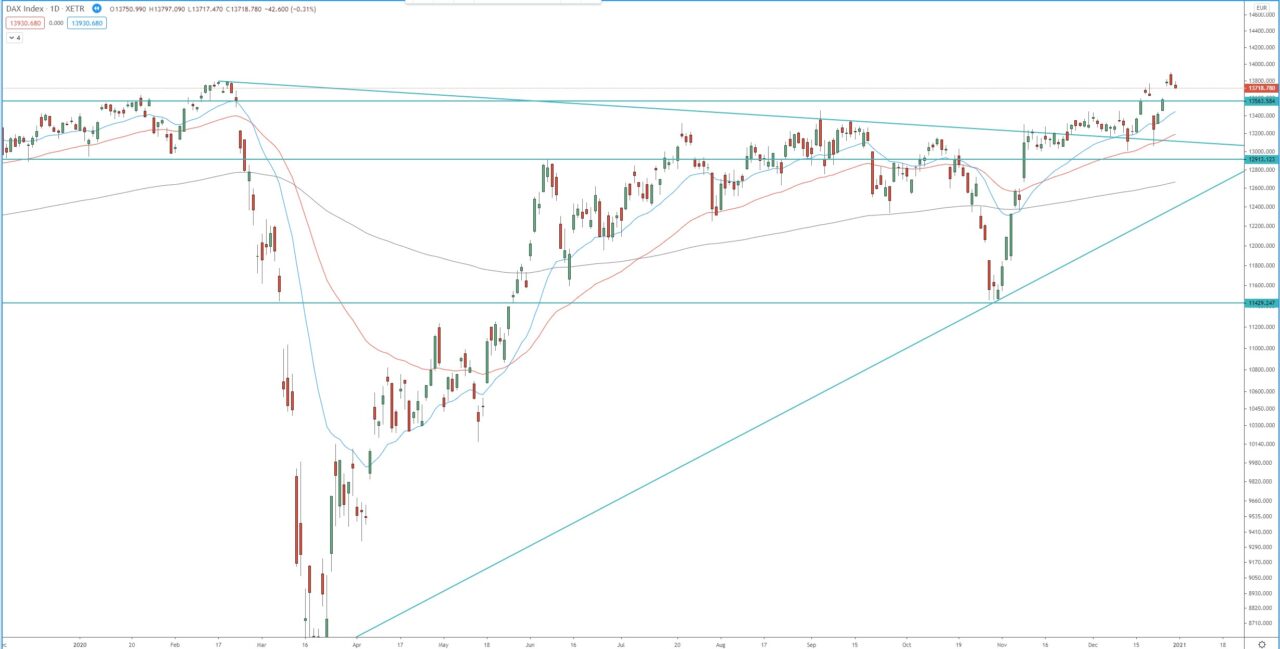
The daily chart is within is 3rd bullish wave as well, the index is approaching the first target of that wave at 1.272 FIB extension around 13 950, the second target of that bullish wave is the 1.618 FIB around 15 000. The support between 12 920 – 13 000 and the ascending trend line on the daily are the first support to watch in case of a pullback for rejection and resumption of the bullish trend.
Monthly chart:

Weekly chart:

Daily chart:


