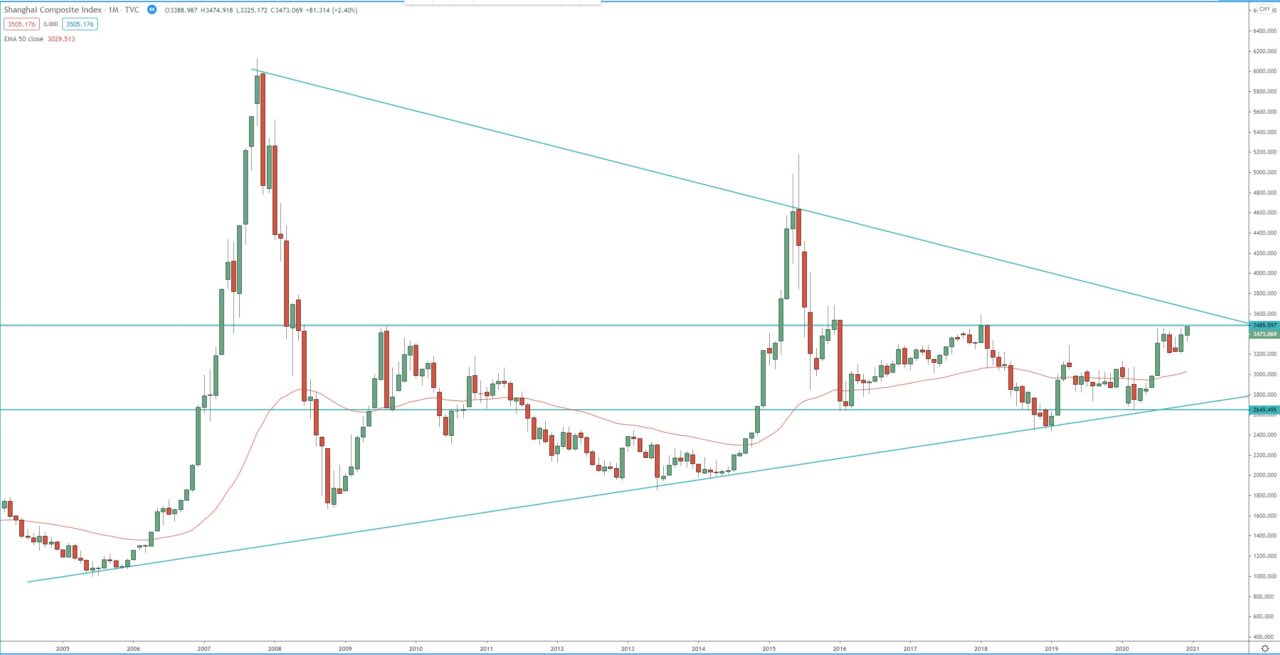
Looking at the monthly chart, we can see that the index is in consolidation in a range, that has been forming since 2016. While in consolidation the index bounced from long term dynamic support (ascending trend line).
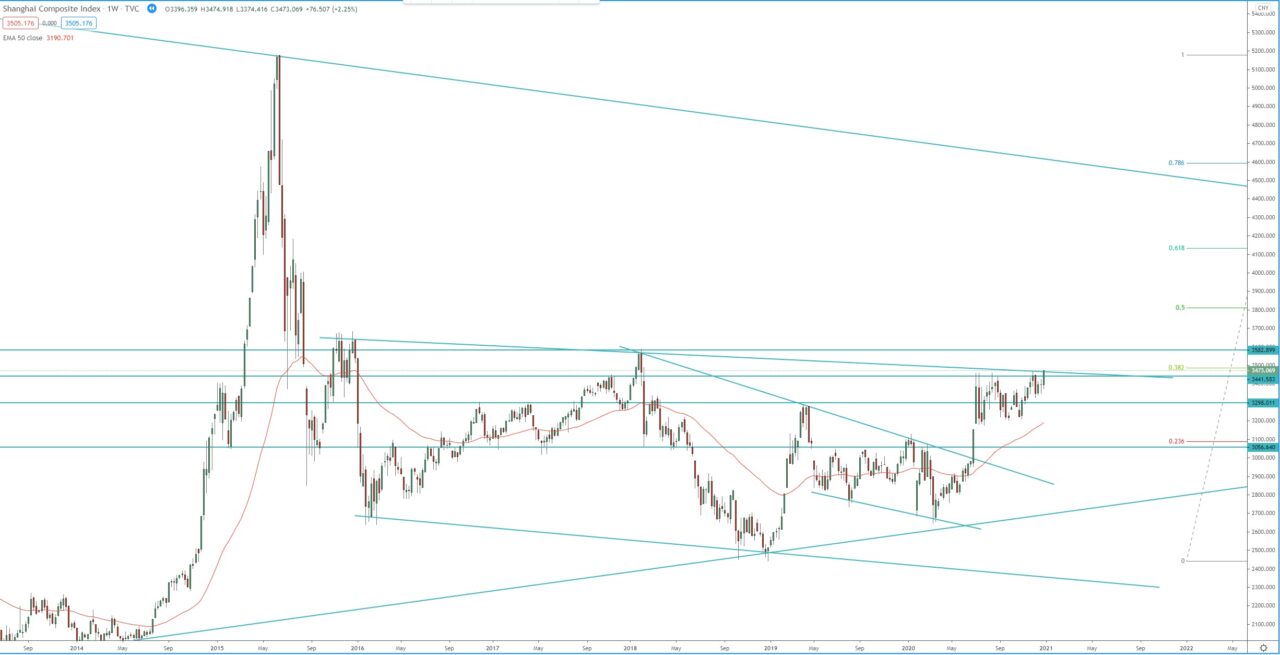
The index broke above bullish flag on the weekly chart, which was formed after the initial bullish momentum in the begging of the 2019. Now the index is attempting a run to break above very important horizontal and dynamic resistance zone. If we see break above, first 3580 and then above 3700 we should see acceleration of the bullish momentum toward 0.618 FIB retracement around 4100.
In case of a pullback, key support level to watch for rejection and resumption of the bullish trend are: 3350 – 3300, 3200 – 3100.
Monthly chart:

Weekly chart:


