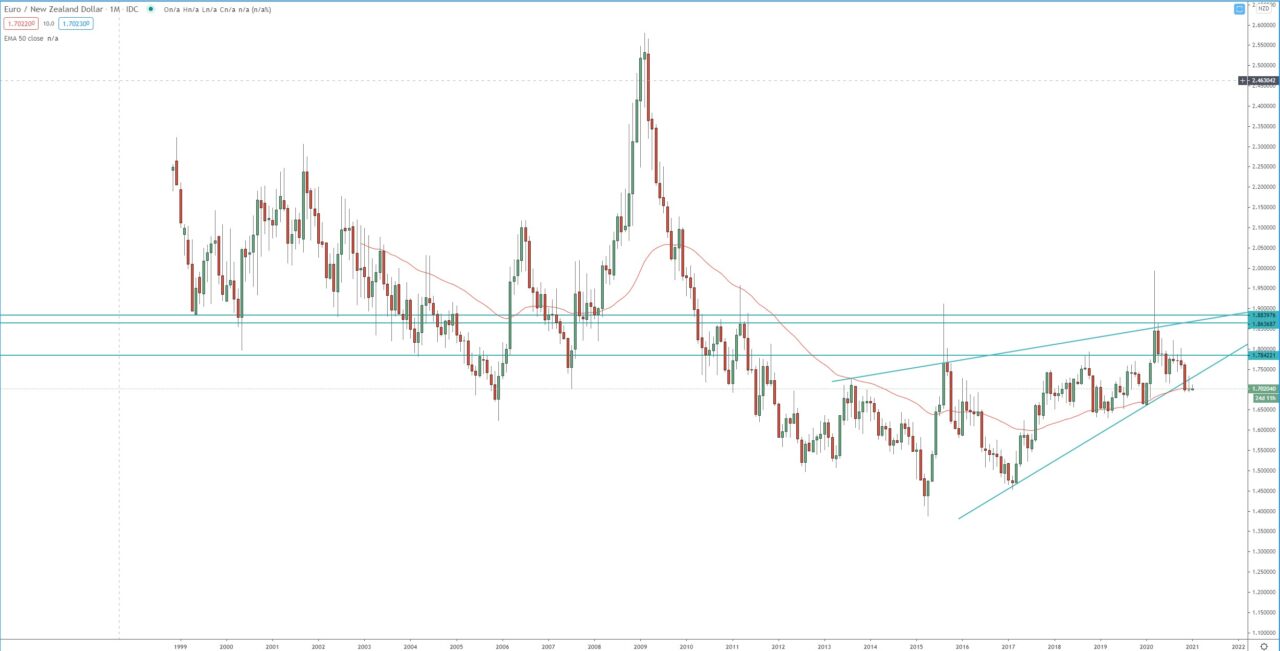
After the initial spike in the beginning of the pandemic the price rose briefly above key resistance between 1.8650 – 1.8850, however, it was not able to close above it on the monthly chart. That resistance zone has been holding the price for 10 years.
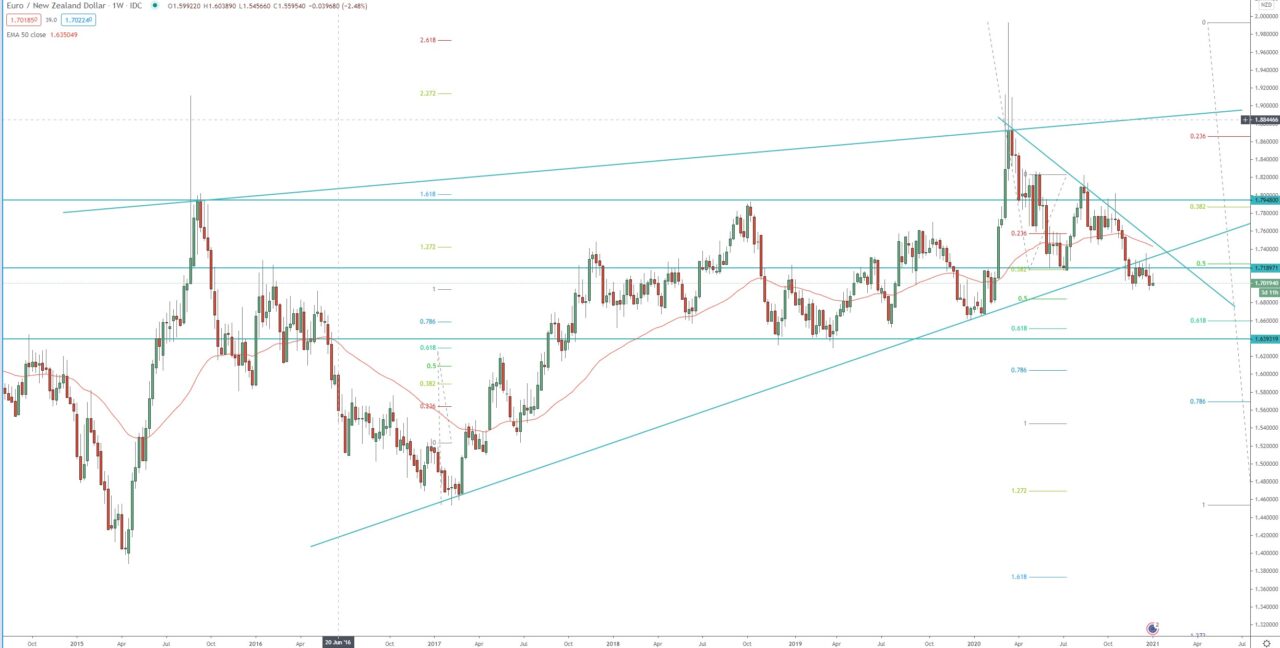
The weekly chart is within its 3rd bearish wave. The first target of the weekly bearish wave is 1.272 FIB around 1.4700, where we have support as well.
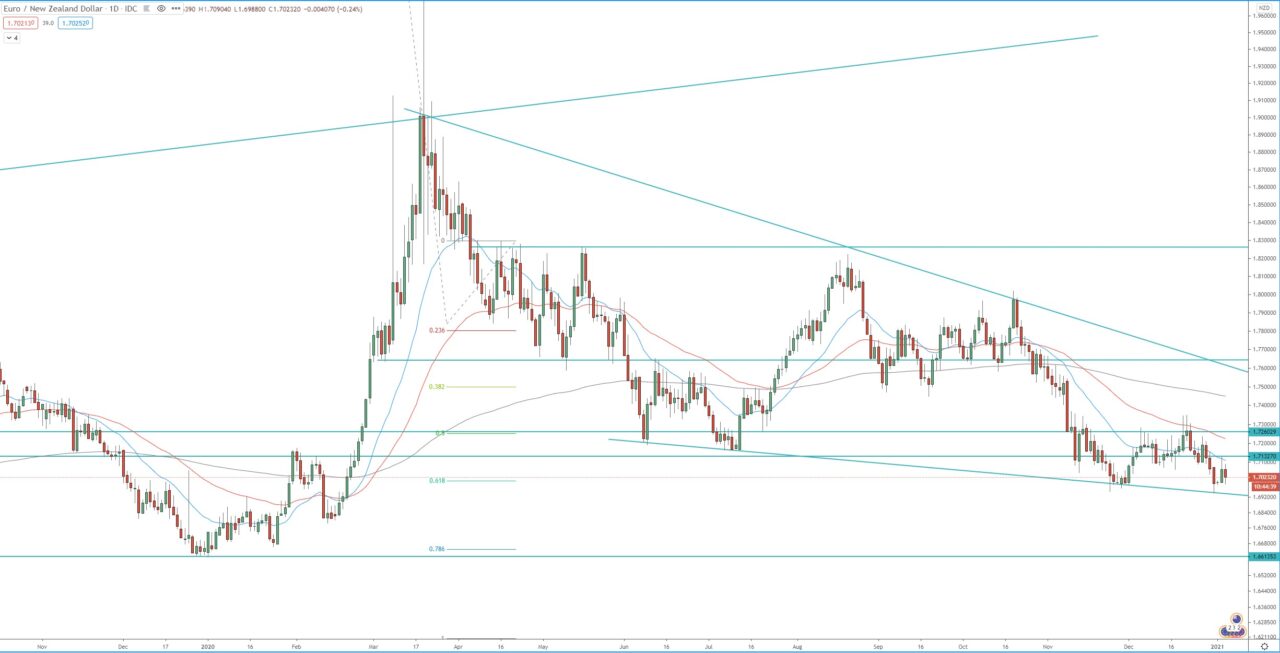
The daily chart is within its 3rd bearish wave. The first target of the daily bearish wave is at 1.272 FIB around 1.5650. Before that we have strong support around 1.6600 – 1.6650 and we need to see break below that support, before we can consider the above targets.
At this point the resistance around 1.7250 should be monitored for rejection resumption of the bearish trend. Above 1.7250 we have strong resistance around 1.7600 – 1.7650.
Monthly chart:

Weekly chart:

Daily chart:


