The decline in the 10-year bond accelerated in January 2020, because of the COV19 pandemic and the FED fast interest rates cut and introduction of several liquidity/loan programs designed to support the economy and the business!
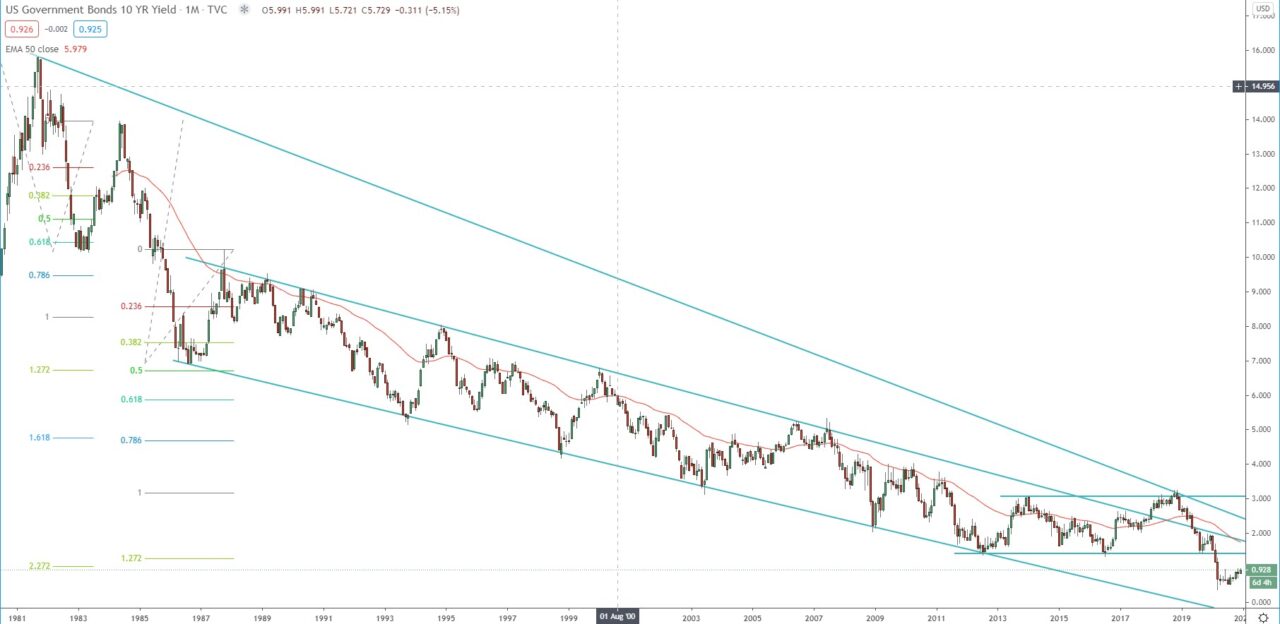
The momentum in the decline was strong enough to break significant support, below 1.425 – 1.50. The decline reached 2.272 FIB extension which was the 3rd target for the 3rd wave of the bearish monthly trend.
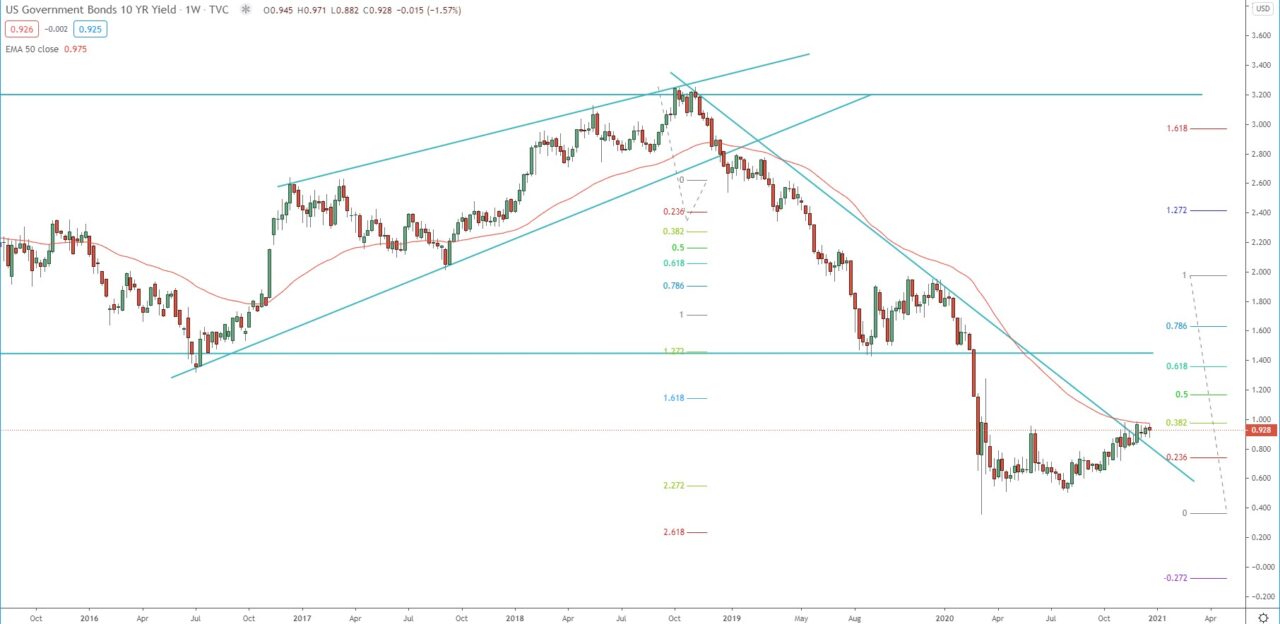
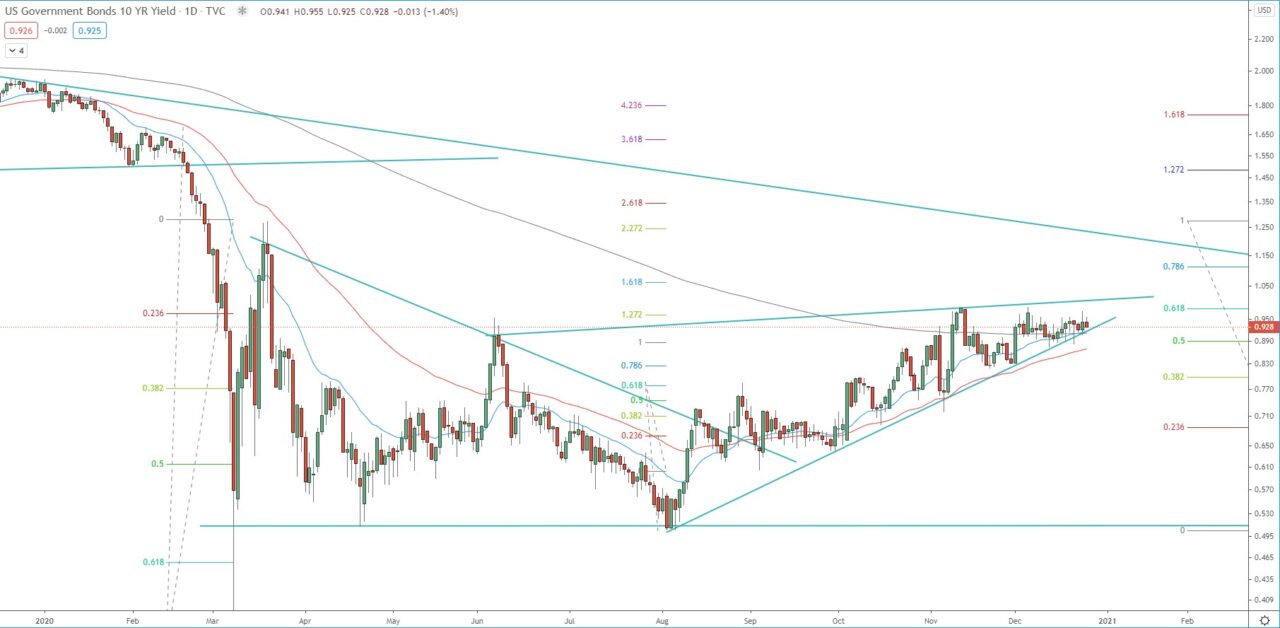
All timeframes are still bearish and we need to see further development in the price action to determine what is next to come. However, if the price break above the 0.618 FIB and the weekly 50 EMA and daily resistance around 0.99 – 1.00 we will see further upside toward the March highs around 1.27, break above it should push the price toward the resistance between 1.425 – 1.50. Again, FED action will determine what is next to come, but a reasonable assumption is that during 2021 the US 10-year yield will end up closer to 1.27 rather than 1.45%!
Monthly chart:

Weekly chart:

Daily chart:


