|
Getting your Trinity Audio player ready...
|
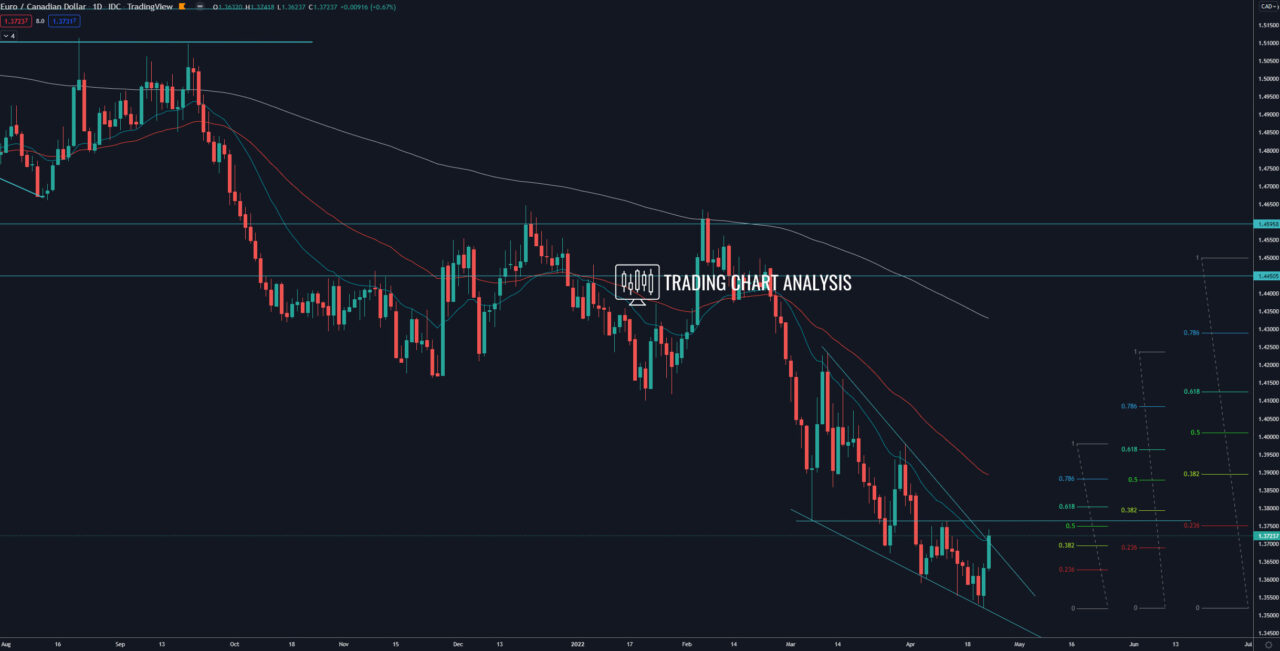
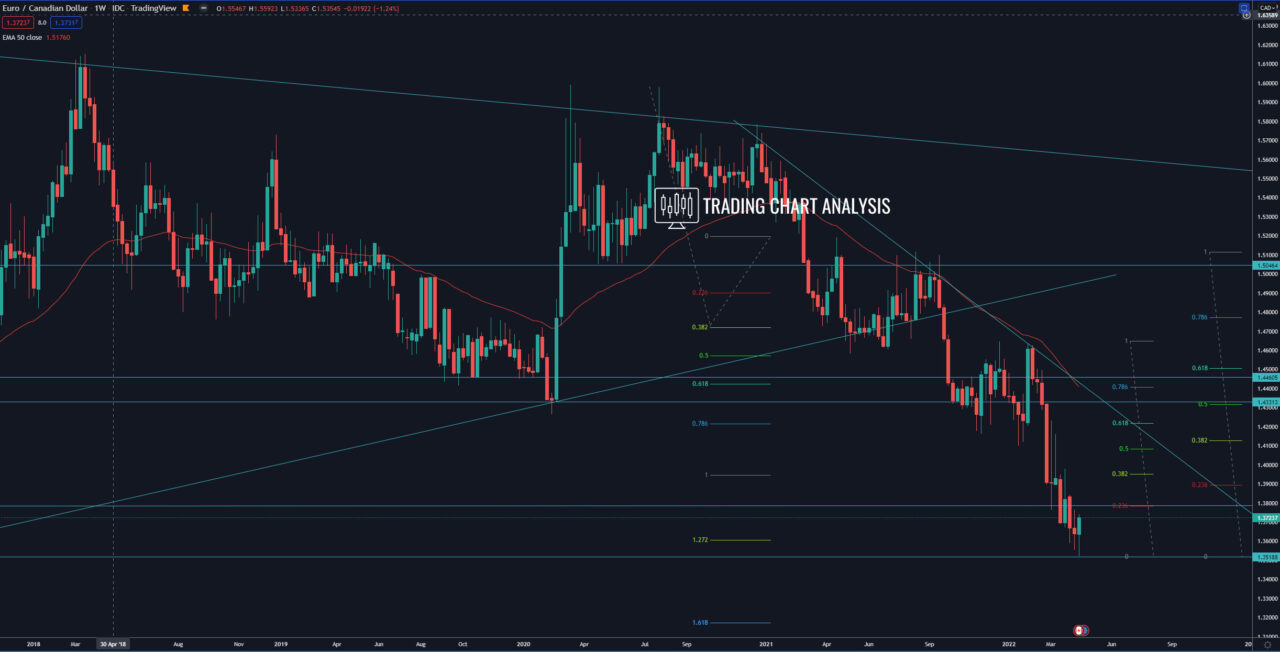
Technical analysis for the EUR/CAD, the pair reached the first target of the bearish wave on the weekly chart, the 1.272 FIB extension at 1.3600 and support at 1.3550 and rejected it with a tweezer bottom on the weekly chart. This rejection is a sign of the begging of a potential pullback on the weekly chart. On the daily chart, the EUR/CAD formed a descending wedge which is another sign of a potential pullback. The first target for this pullback in the EUR/CAD is the 0.382 FIB retracement on the weekly chart at 1.3950, where we have resistance and a previous high on the daily chart. However, before that, we need to see the price of EUR/CAD breaking above the wedge and above the resistance, and high on the daily chart at 1.3765.
On the other hand, if the EUR/CAD closes below 1.3500 on the weekly char, that will resume the bearish wave on the weekly chart. The second target for this bearish wave is the 1.618 FIB extension on the weekly chart at 1.3175.
Daily chart:

Weekly chart:

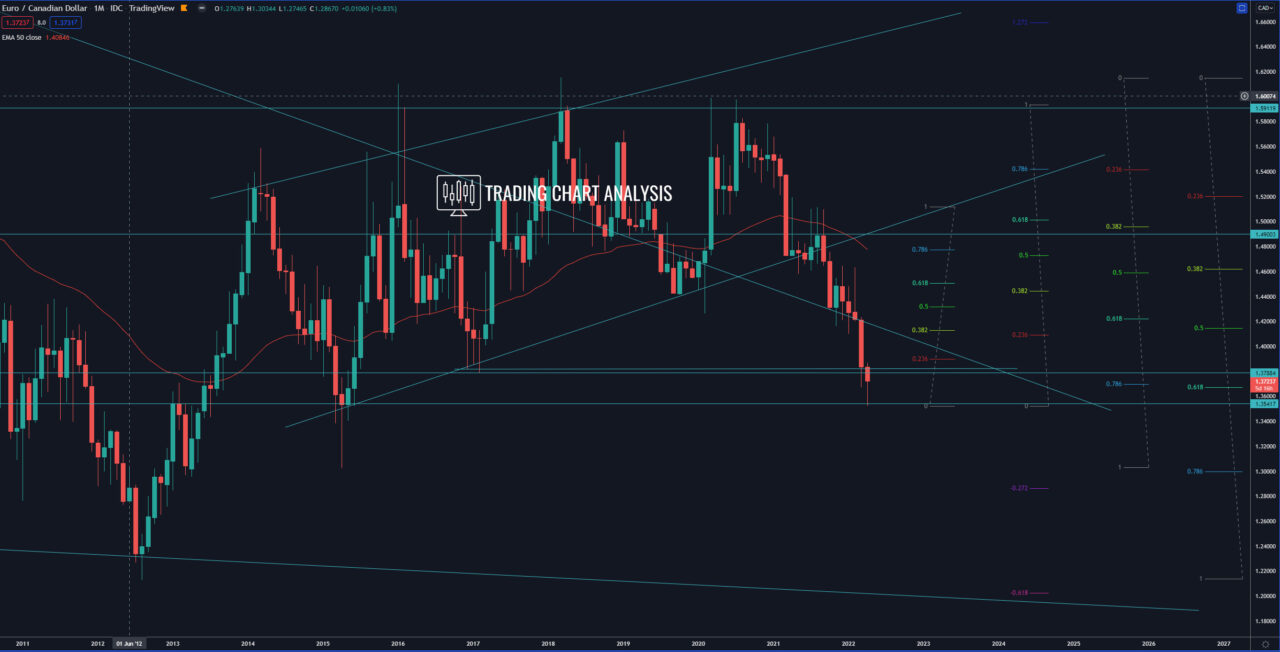
Monthly chart:


