|
Getting your Trinity Audio player ready...
|
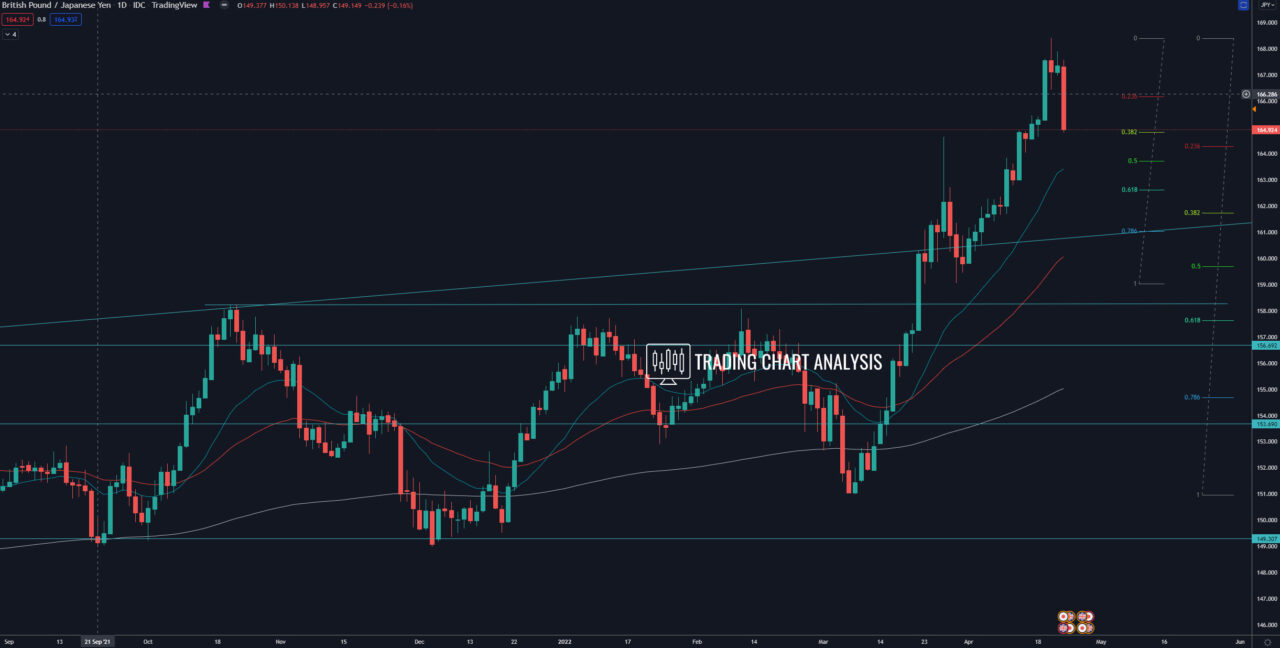
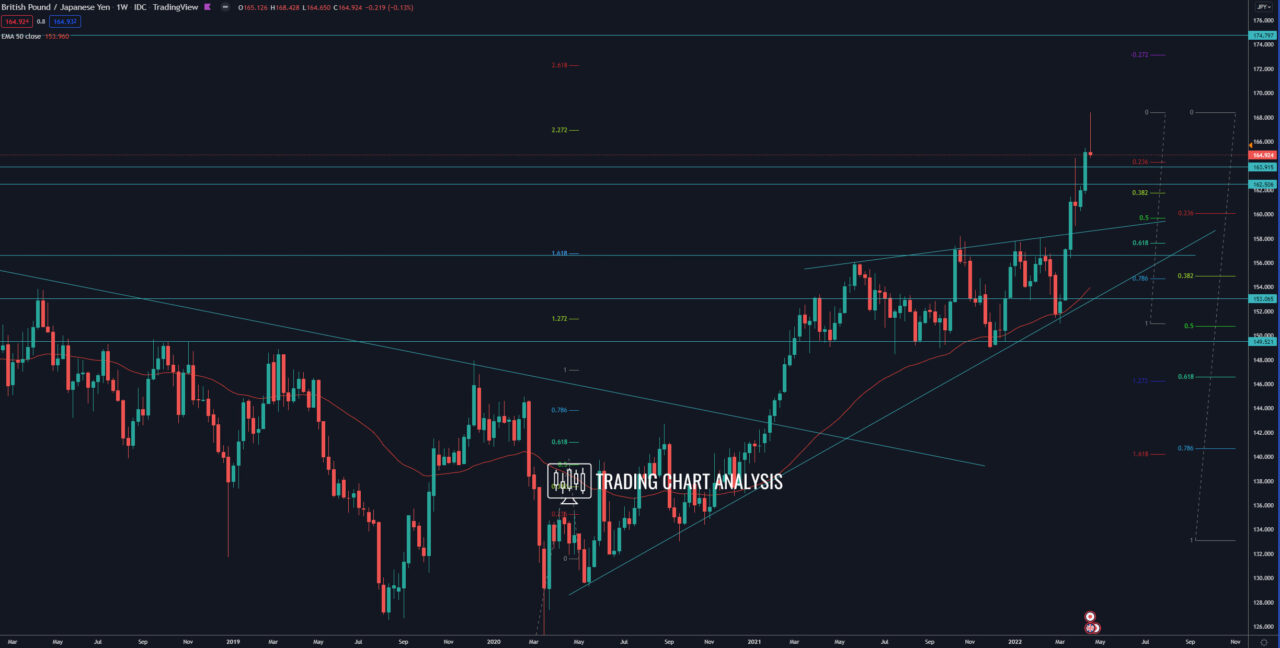
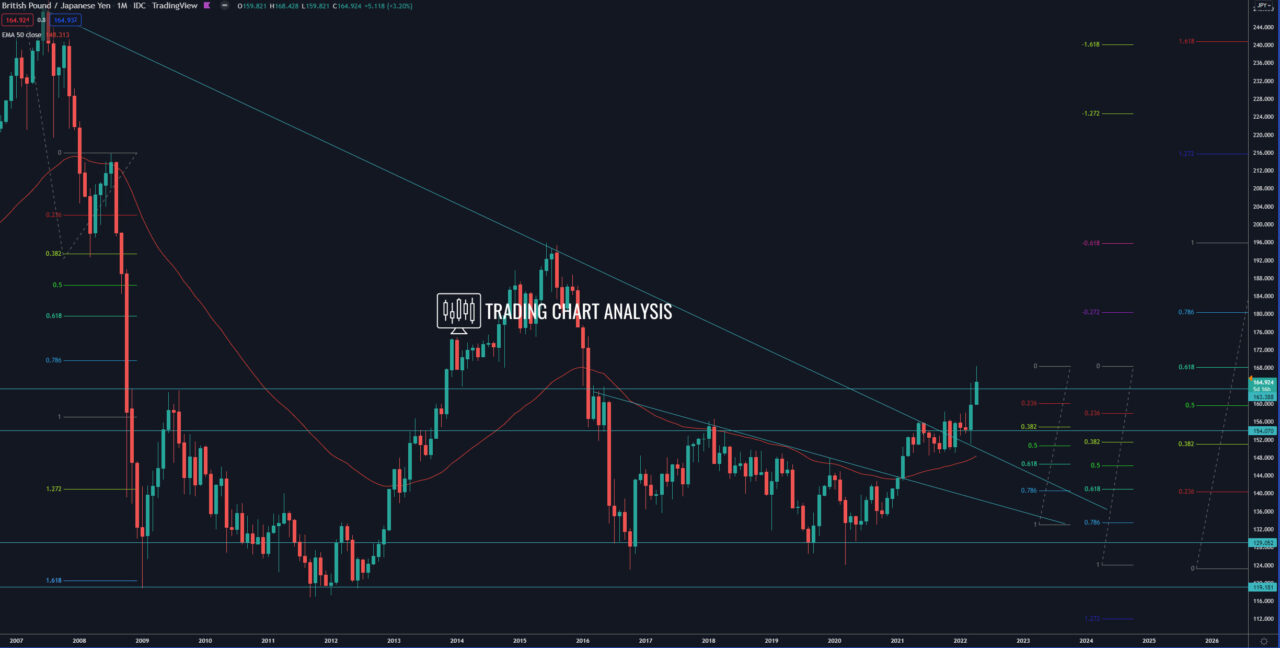
Technical analysis for the GBP/JPY, the pair reached the third target of the bullish wave on the weekly chart, the 2.272 FIB extension at 167.00. The price went as high as 168.42, where we have the 0.618 FIB retracement on the monthly chart and rejected it with a high-test candle on the weekly chart, starting a pullback on the weekly chart. The first target of this pullback is the 1.618 FIB extension on the one-hour chart at 164.60, the price of GBP/JPY is almost there. The second target is the 0.618 FIB retracement on the daily chart at 162.60. The third target for the pullback in GBP/JPY is the 0.382 FIB retracement on the weekly chart at 161.75.
On the other hand, if the price of GBP/JPY closes above the previous high and above the 0.618 FIB retracement on the weekly chart at 168.42, it will resume the bullish wave on the weekly chart. The third target of the bullish wave is the 2.6187 FIB extension at 172.30.
Daily chart:

Weekly chart:

Monthly chart:


