|
Getting your Trinity Audio player ready...
|
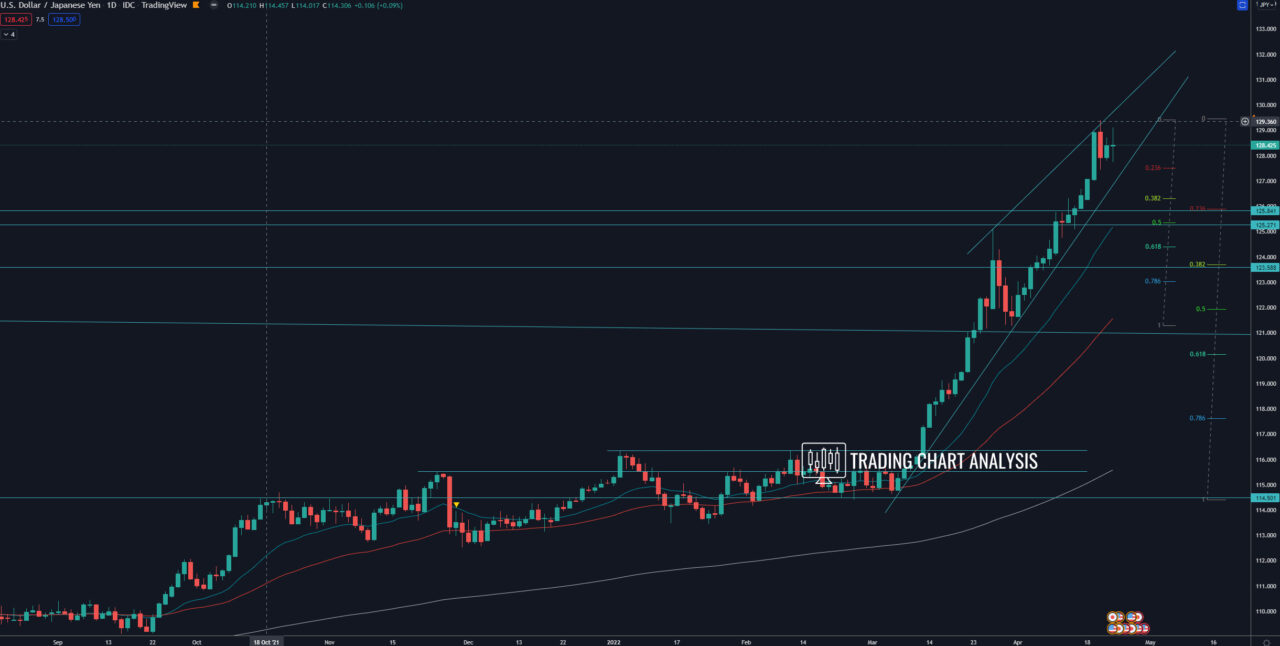
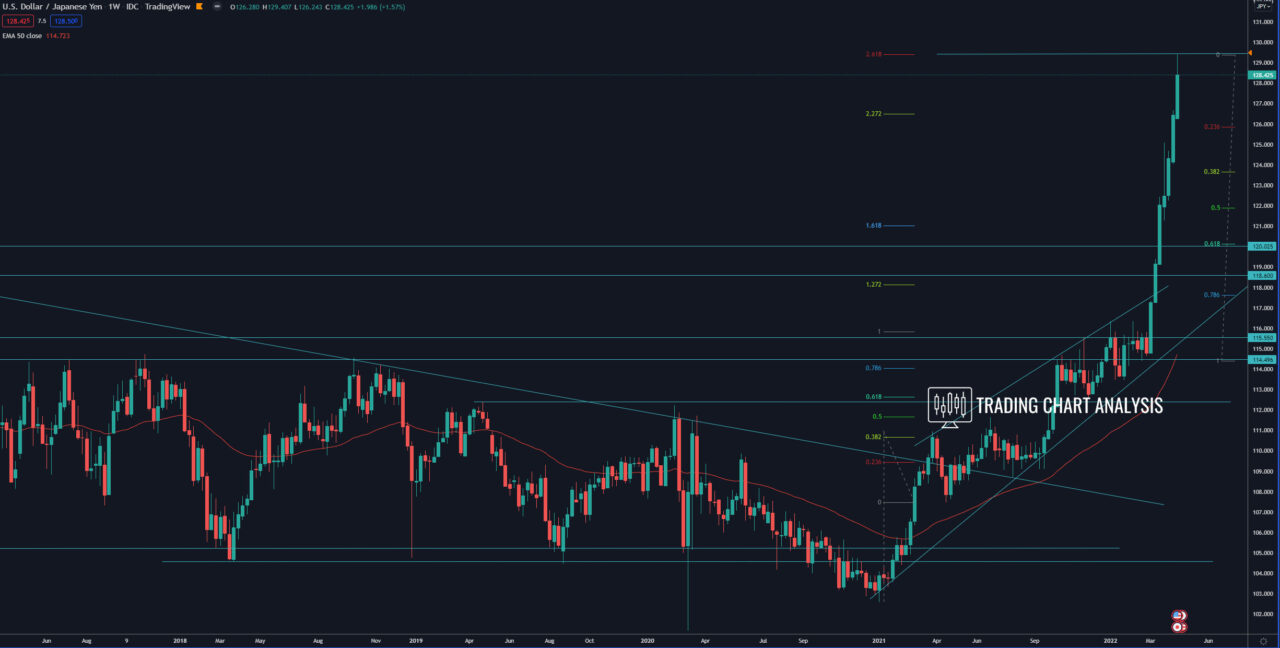
Technical analysis for the USD/JPY, the pair reached the fourth target of the bullish wave on the weekly chart, the 2.618 FIB extension at 129.30. The bullish momentum is still strong, and we can’t rule out a spike toward the 130.00. However, since the USD/JPY reached the fourth target of the bullish wave on the weekly chart and the price is overbought on both the weekly and the daily charts, we can expect a pullback. If the price of the USD/JPY breaks below the range on the one-hour chart, below 127.43, that will start a deeper pullback. The first target for this potential pullback on the USD/JPY is the 0.382 FIB retracement on the daily chart at 126.30. The second target is the support zone between 125.85 and 125.25. The third target of the pullback for the USD/JPY is the 0.618 FIB retracement on the daily chart at 124.40. The fourth target is the 0.382 FIB retracement on the weekly chart at 123.65.
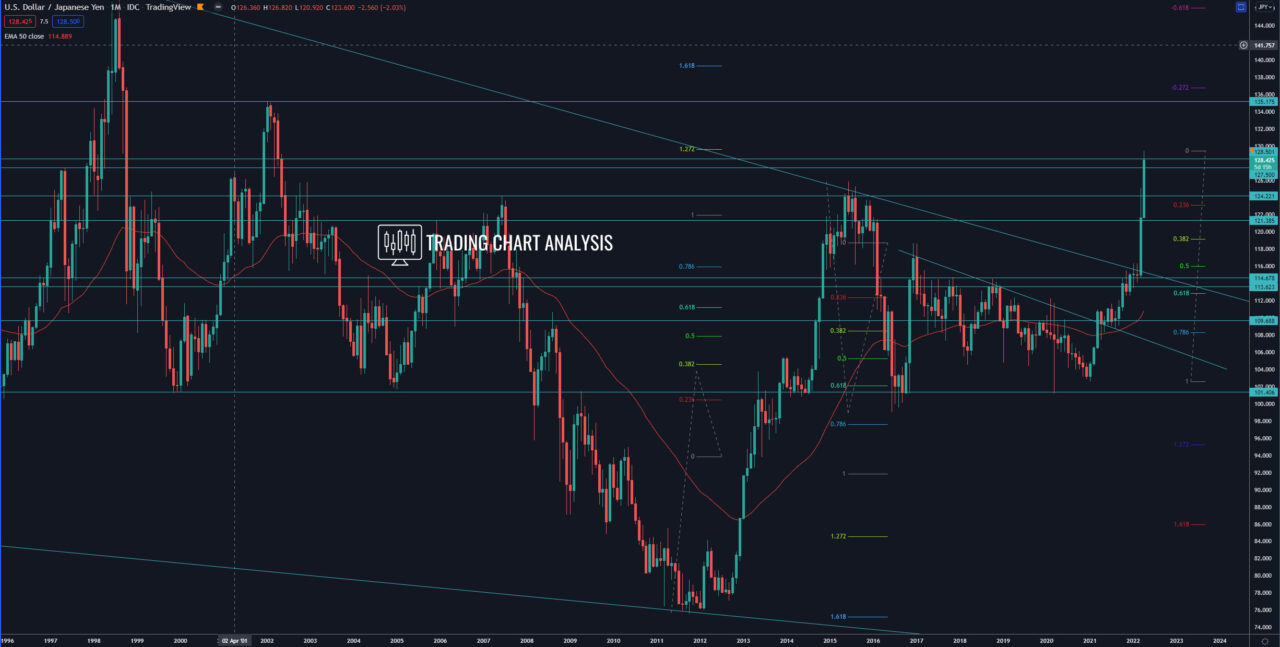
On the other hand, if the price of USD/JPY breaks and hold above 130.00, that will clear the way for a bullish run toward the high on the monthly chart at 135.16.
Daily chart:

Weekly chart:

Monthly chart:


