|
Getting your Trinity Audio player ready...
|
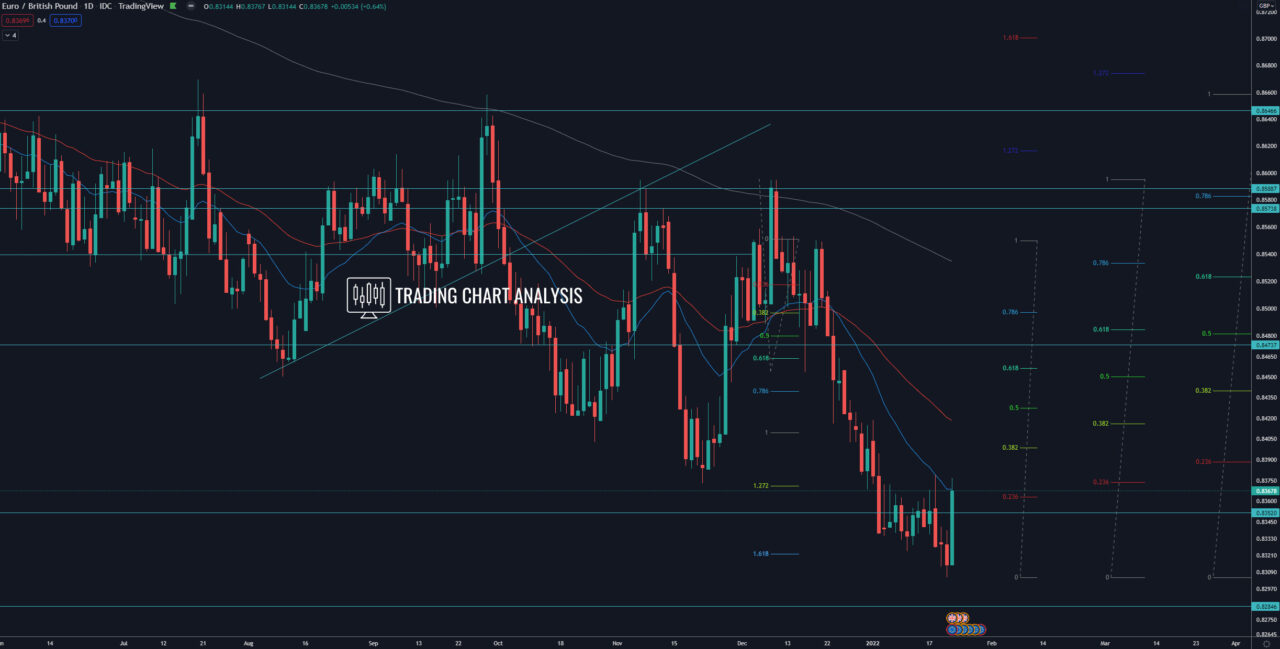
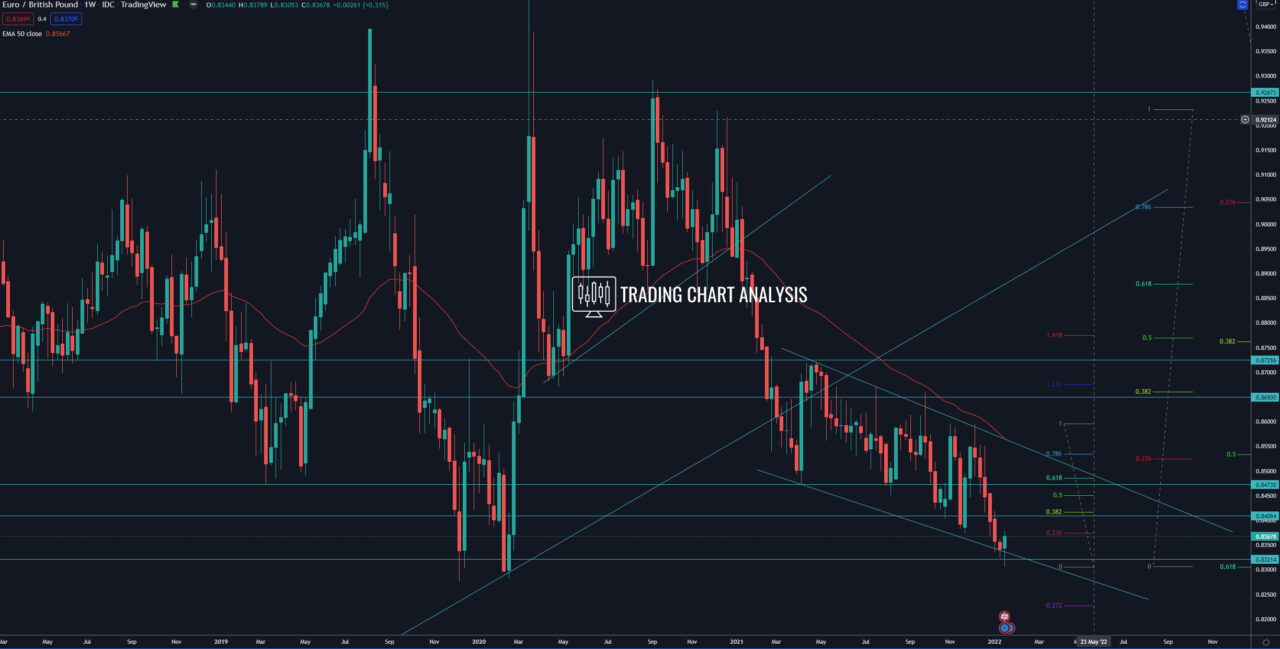
Technical analysis for the EUR/GBP, the pair formed a tweezer bottom pattern on the weekly chart. The EUR/GPB bounced from a support zone, signaling a pullback. The first target for this pullback is the 0.382 FIB retracement on the weekly chart at 0.8415, which is at the daily 50 EMA. However, we need to see a break above the resistance on the daily chart at 0.8378. The second target for the pullback in the EUR/GBP is the 0.618 FIB retracement on the weekly chart at 0.8485.
Looking at the weekly chart, the bearish wave, which started with the first leg down in March of 2020, is not completed yet. The first target of this bearish wave on the weekly chart for the EUR/GBP is the 1.272 FIB extension at 0.8240. The second target is the 1.618 FIB extension at 0.7950.
Daily chart:

Weekly chart:


