|
Getting your Trinity Audio player ready...
|
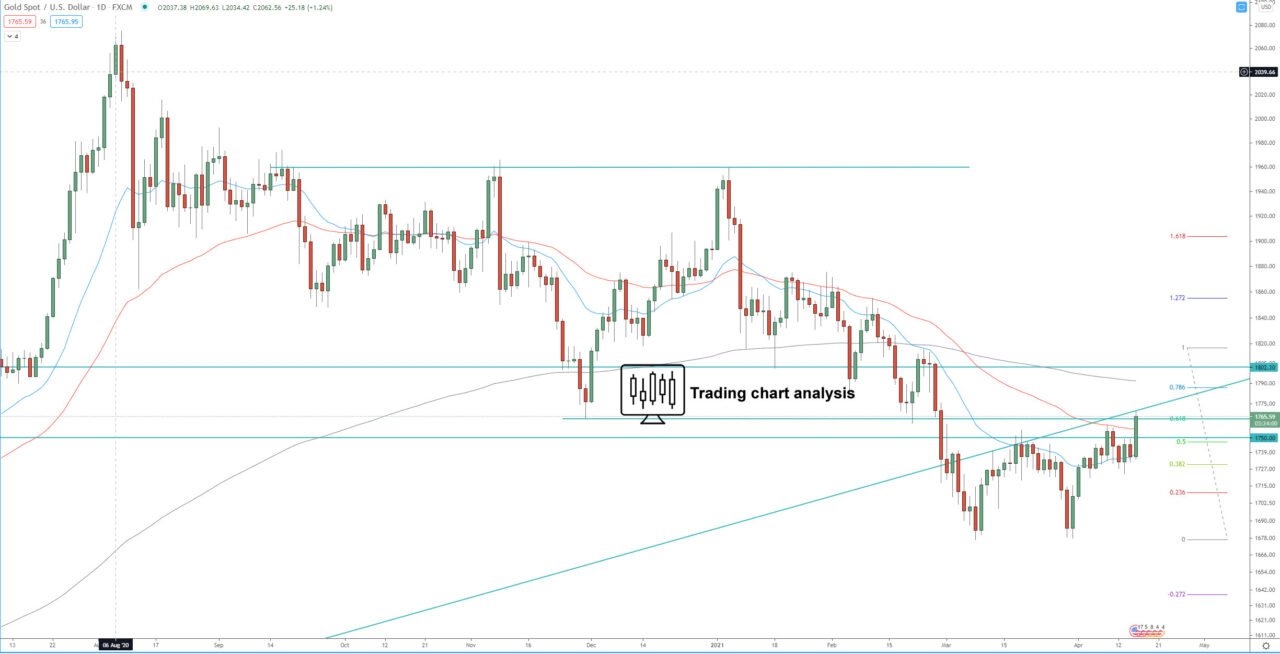
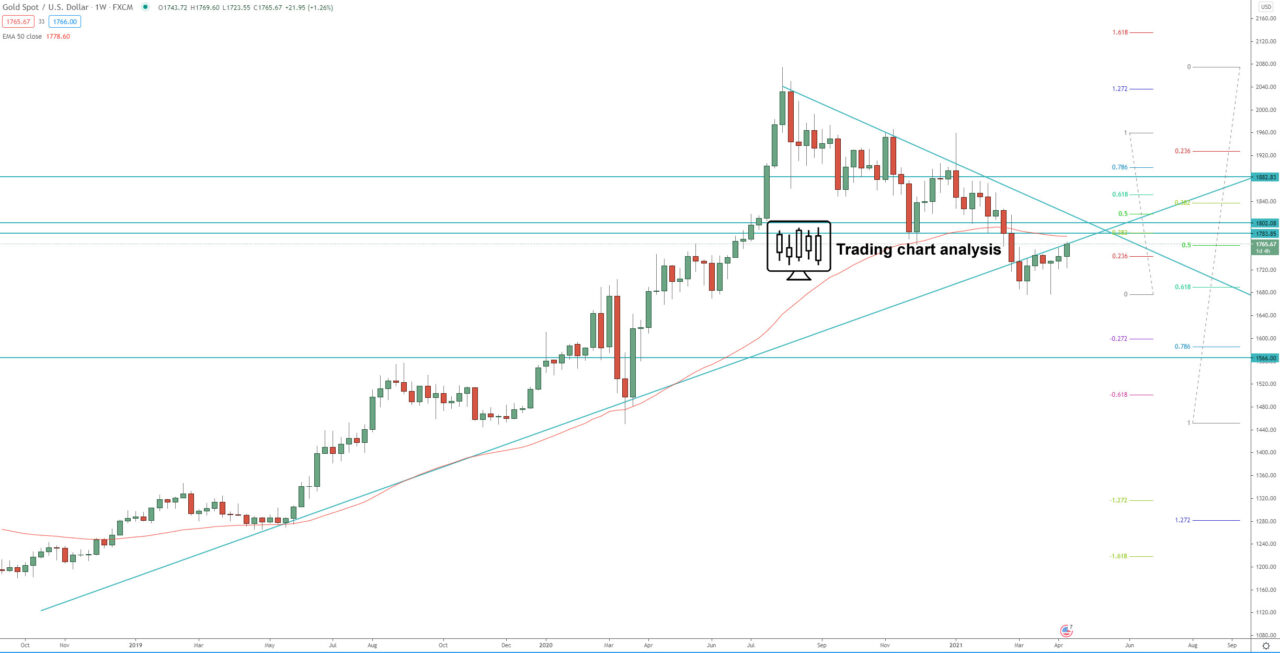
Technical analysis for Gold (XAU/USD) is showing that the price formed a double bottom on the weekly and the daily chart, and now it is attempting a break above 1765$. If the price break above 1765$, it will be a signal for further upside potential toward, first the 0.386 FIB retracement and resistance at 1785$, and second toward the previous daily high at 1815$.
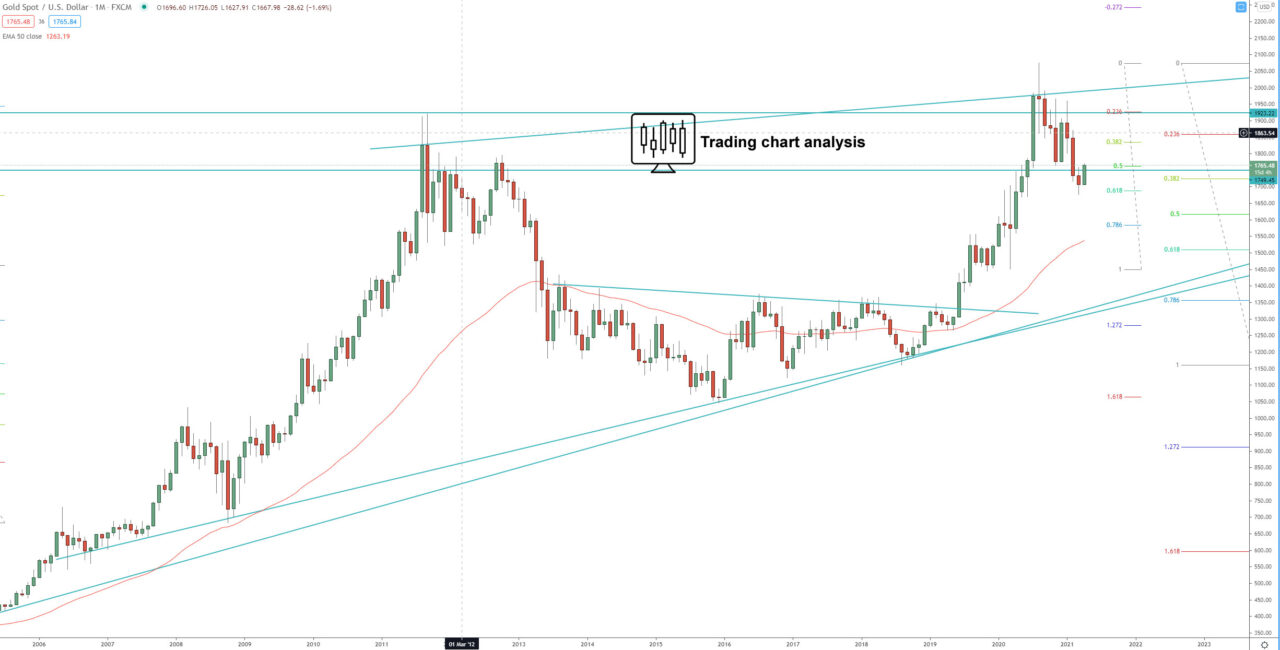
Furthermore, the double bottom pattern and the potential break above 1765$ could be the start of the 5th weekly bullish wave and may lead to a bullish run toward the previous all-time high at 2074$. However, we need further price action to determine that.
On the other hand, if the price of Gold (XAU/USD) fails to break above 1765$ and break back below 1721$, it will be a signal for another retest of the previous low at 1677$ and further consolidation.
Review our technical analysis for Gold (XAU/USD) for 2021 targets.
Daily chart:

Weekly chart:

Monthly chart:


