|
Getting your Trinity Audio player ready...
|
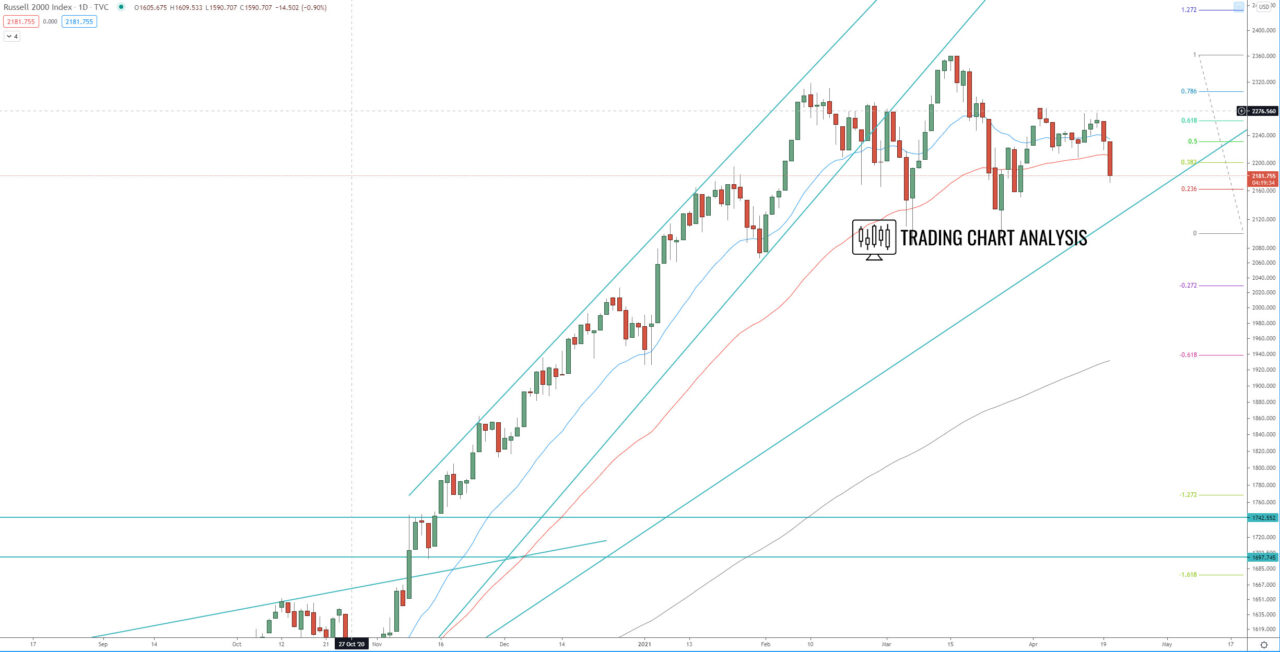
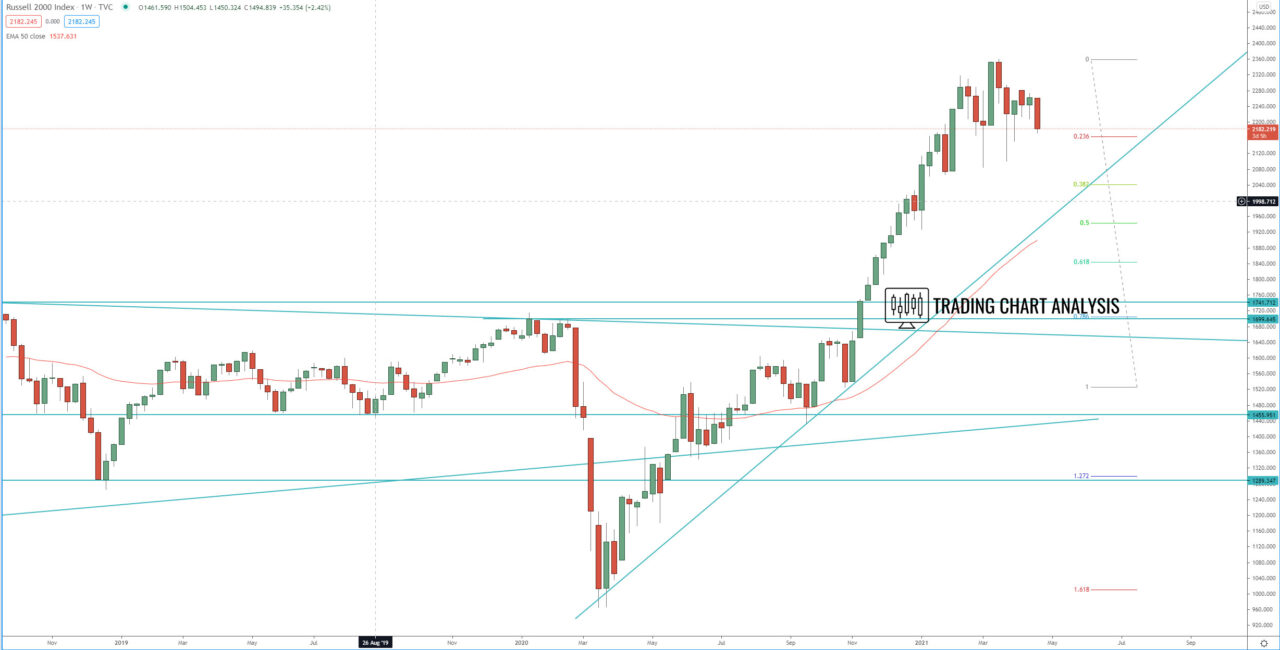
Technical analysis for Russell 2000 is showing that after hitting the second target of the third weekly bullish trend at 1.618 FIB extension at 2275 the index started consolidation. This consolidation formed Head and Shoulders on the daily chart, which is an early sign for potential declines. The focus is now on 2085, if the index break below that level, we may see an acceleration of the declines toward, first 1.272 FIB extension at 1950 and the second toward 1.618 FIB extension at 1860.
On the other hand, if the Russell 200 index break above 2274 it will invalidate the bearish setup, and it should resume the bullish trend and send the index higher toward the previous high at 2360.
Review our technical analysis for Russell 2000 index for 2021 targets.
Daily chart:

Weekly chart:

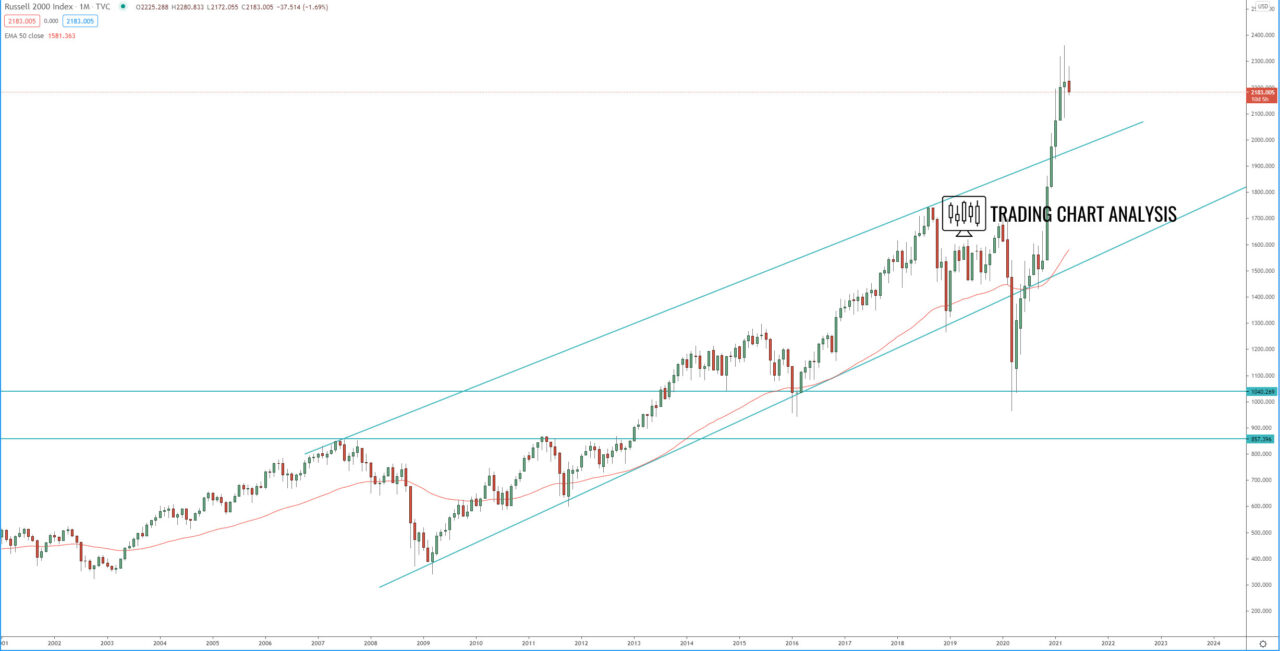
Monthly chart:


