|
Getting your Trinity Audio player ready...
|
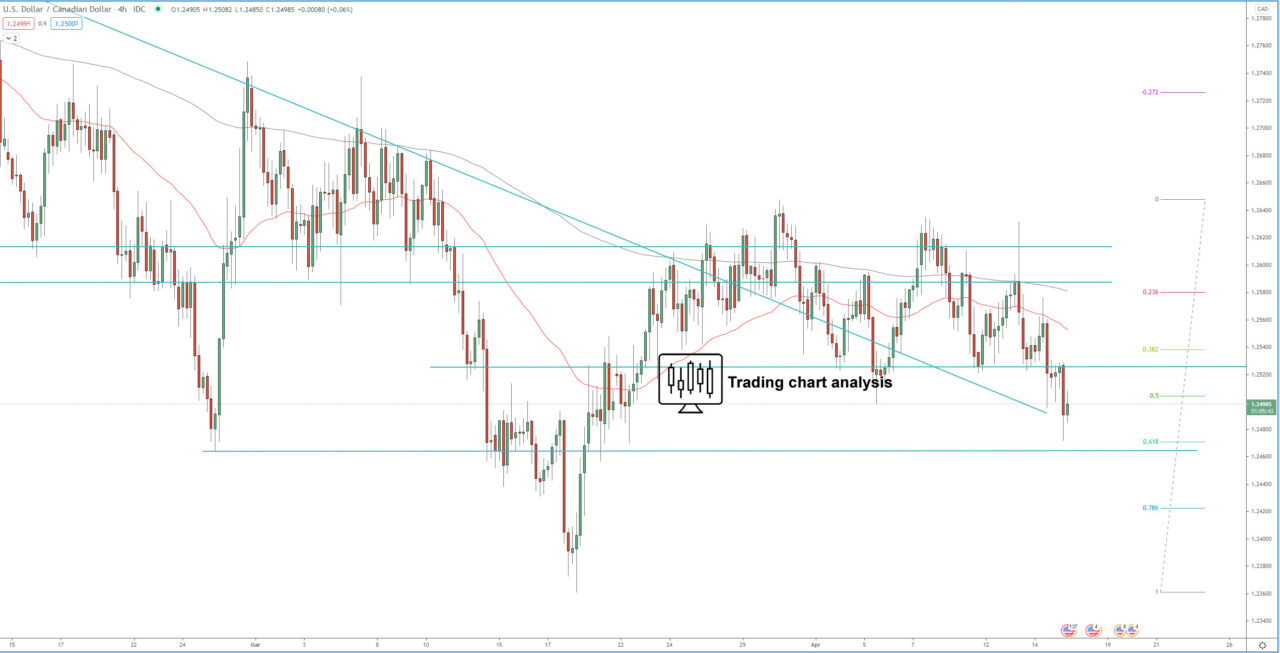
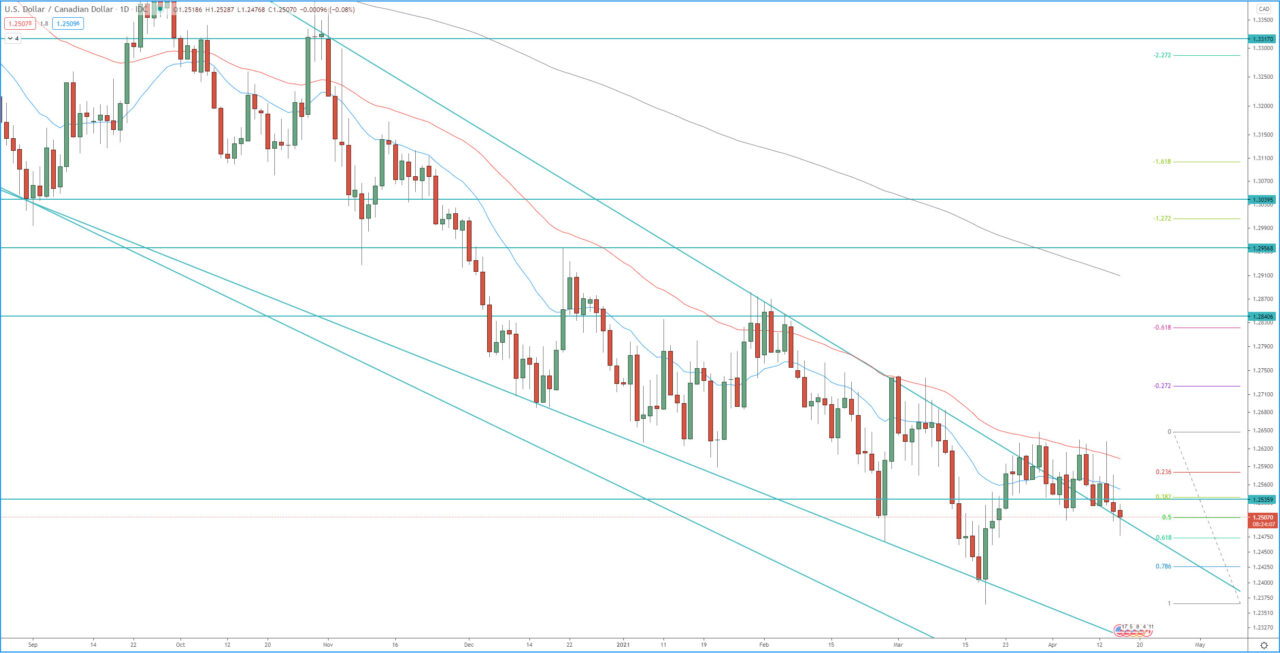
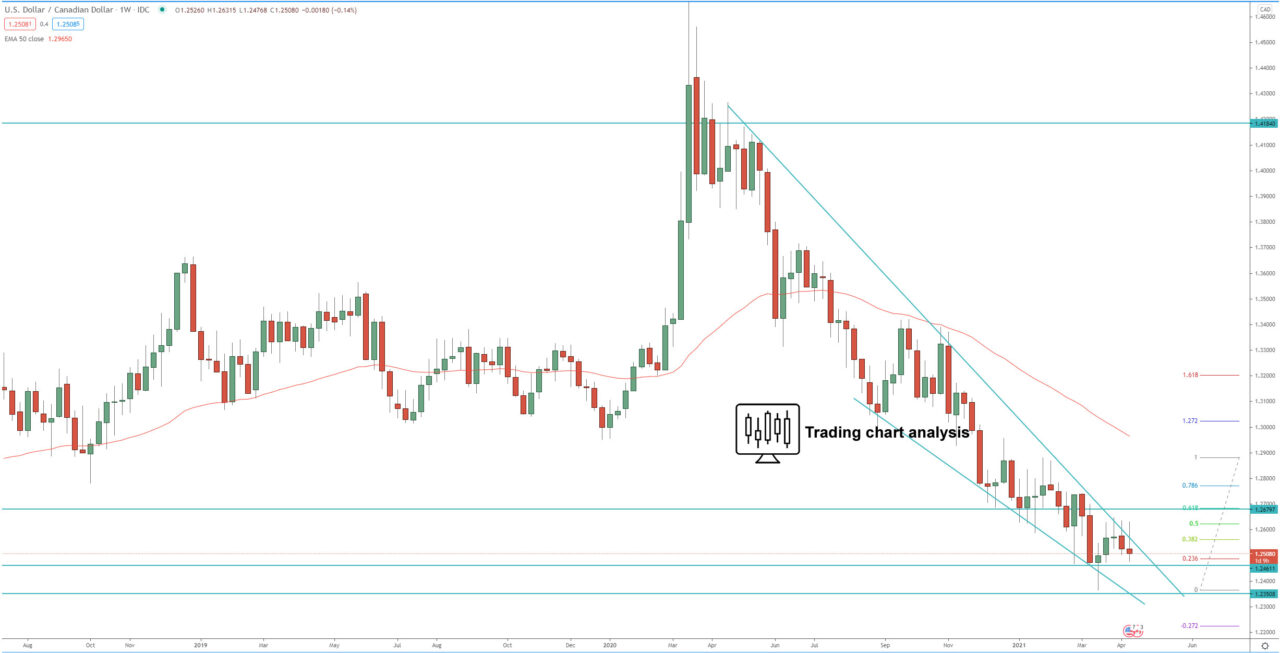
Technical analysis for the USD/CAD pair is showing that the price formed double tops on the daily chart rejecting dynamic resistance on the weekly chart, and breakout below a range, breaking below 1.2520 – 1.2495. This break is a signal for further downside potential, the first target of this break is at 1.2470, which is the 0.618 FIB retracement and the opening price of the weekly low test candle. If the USD/CAD pair breaks below 1.2470, it will send the price lower, toward the previous daily low at 1.2365. If the price break below 1.2365, it will open the door for a bearish run toward the 1.272 FIB extension of the weekly bearish trend at 1.2000.
On the other hand, if the USD/CAD pair breaks above 1.2635, it will be a break above the descending wedge on the weekly chart, and it will send the price higher toward, first the previous high at 1.2740 and second the 1.272 FIB extension at 1.2835.
Review our technical analysis for USD/CAD pair for 2021 targets.
4H chart:

Daily chart:

Weekly chart:


