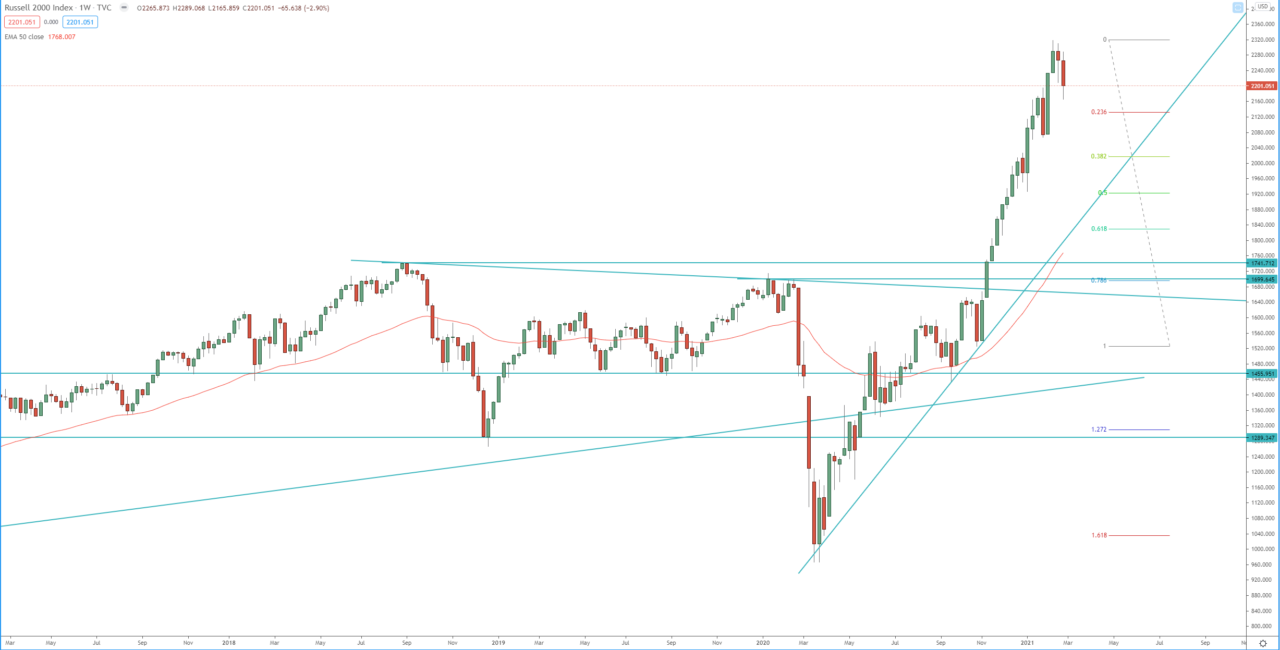
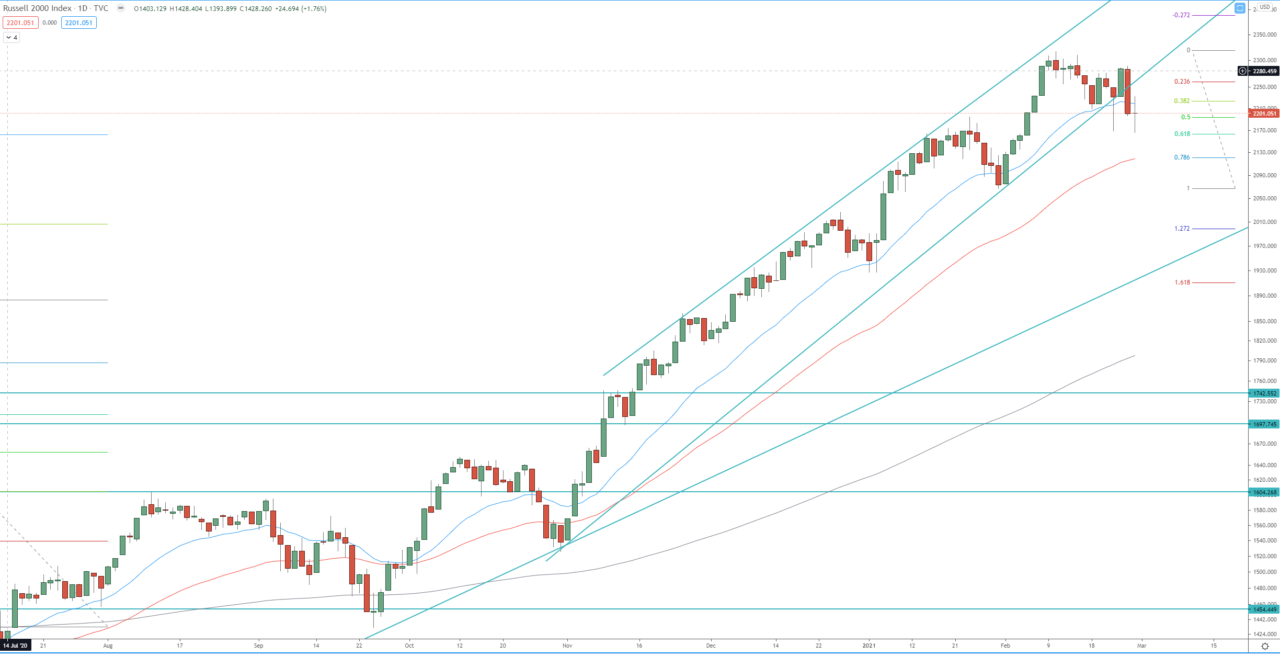
The index reached the second target of the bullish wave on the weekly chart at 1.618 FIB extension around 2280 and started a pullback. The price broke down below ascending price channel on the 4H and the daily chart. However, this break is more like part of the consolidation and retest of the previous daily high, which is now a support. If the index break below last week’s low below 2165 it will extend the pullback toward, first 1.272 FIB extension at 2100, second toward the 1.618 FIB extension at 2050.
On the other hand, if the index breaks above the previous high at 2316 will be a signal for resumption of the bullish trend with the first target 2450, second target 2500.
Review our technical analysis for 2021 for Russell 2000 index.
Weekly chart:

Daily chart:


