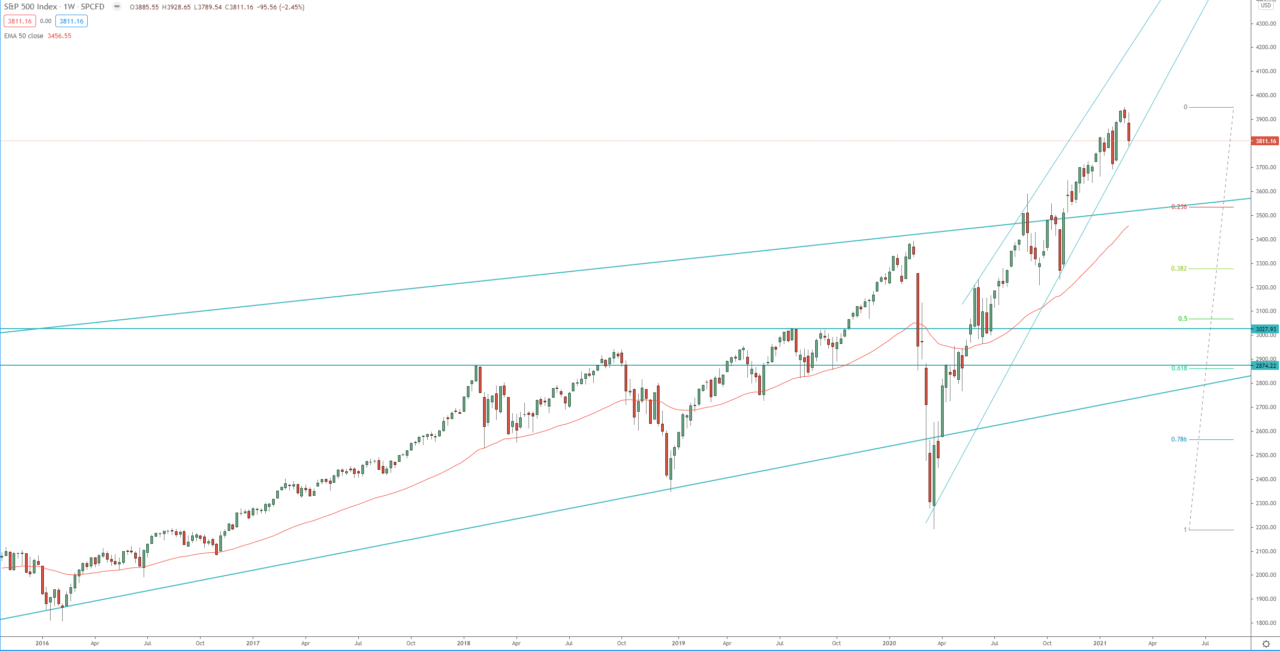
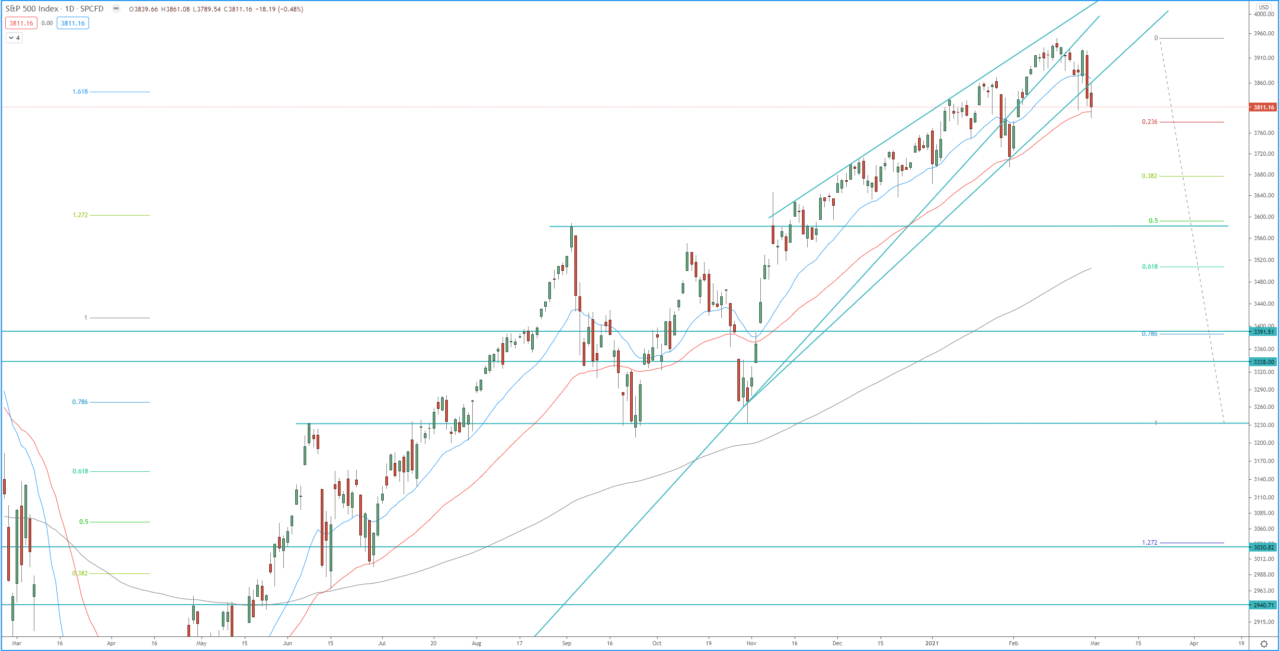
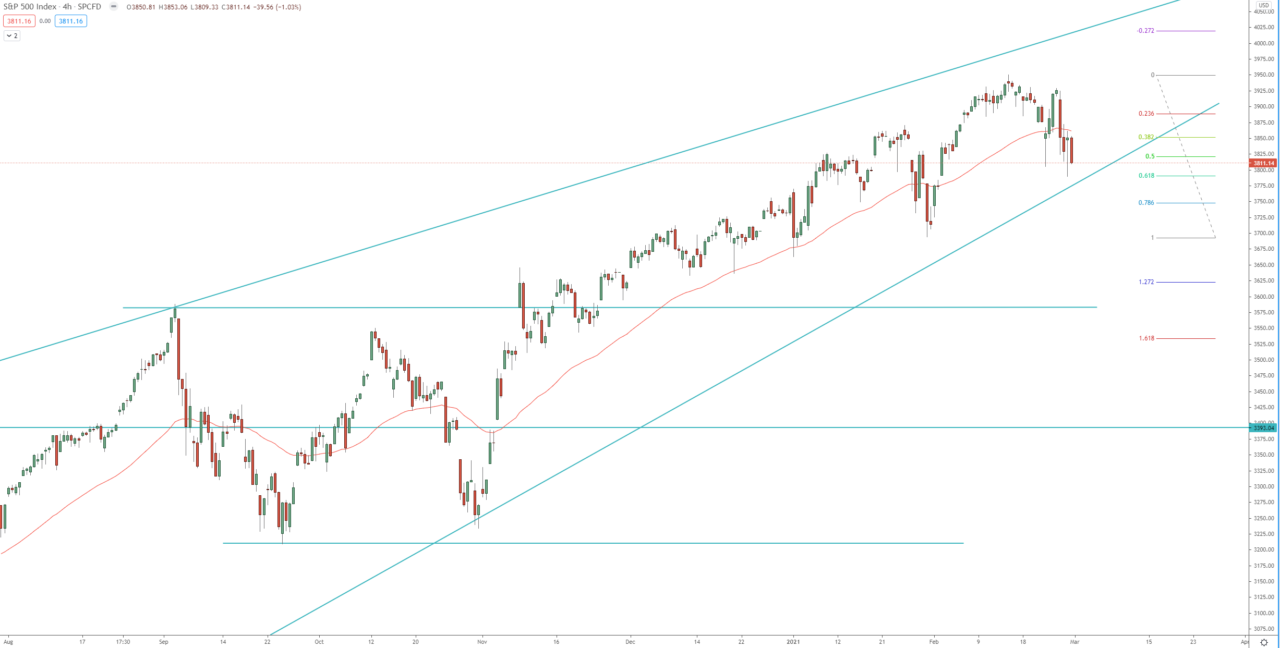
The index closed with tweezer tops on the monthly chart however, it managed to close higher than the previous monthly close. The 1H chart is within a bearish run, the first target of that bearish run is at 1.272 FIB extension around 3750, the second target of that run is at 1.618 FIB extension around 3695, which is the previous daily low. However, the price is sitting on ascending trend line on the weekly, daily, and 4H charts, and at the daily 50 EMA and 0.618 FIB retracement at 3790. Therefore, if the price breaks below all that support, it will extend the bearish run toward the above targets.
On the other hand, if the index breaks back above 3929, it will send the price toward, first the previous high at 3950, and second toward 4000.
Review our technical analysis for 2021 for S&P 500 index.
Weekly chart:

Daily chart:

4H chart:


