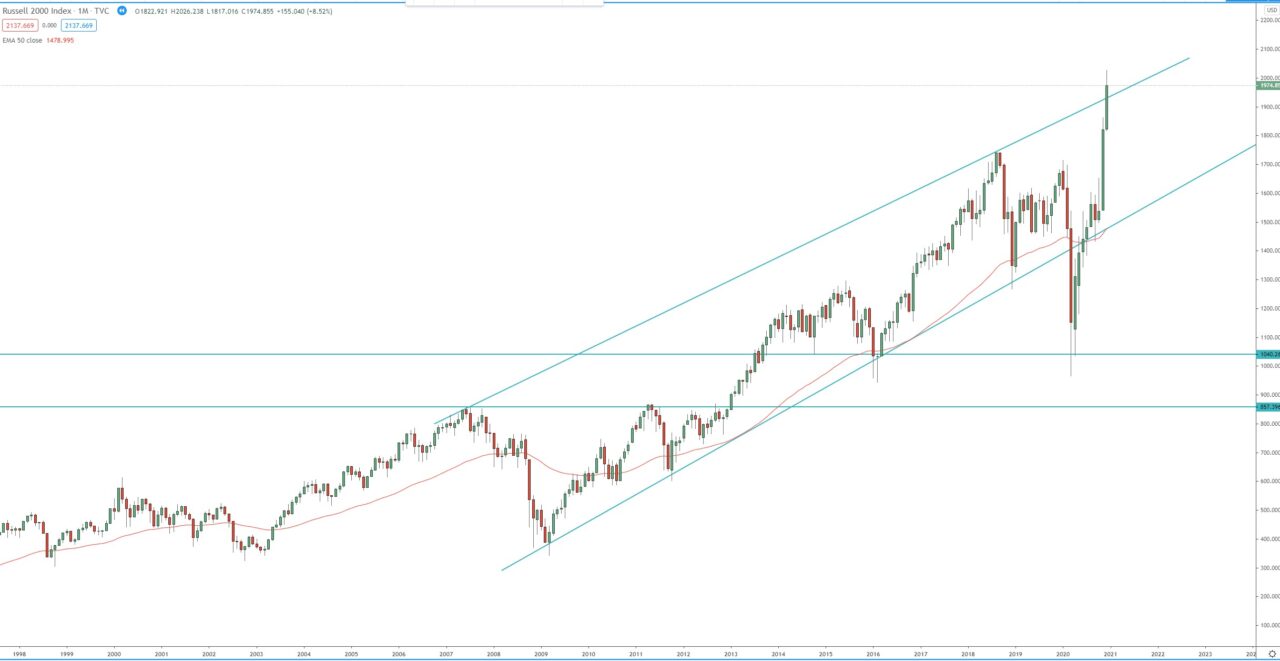
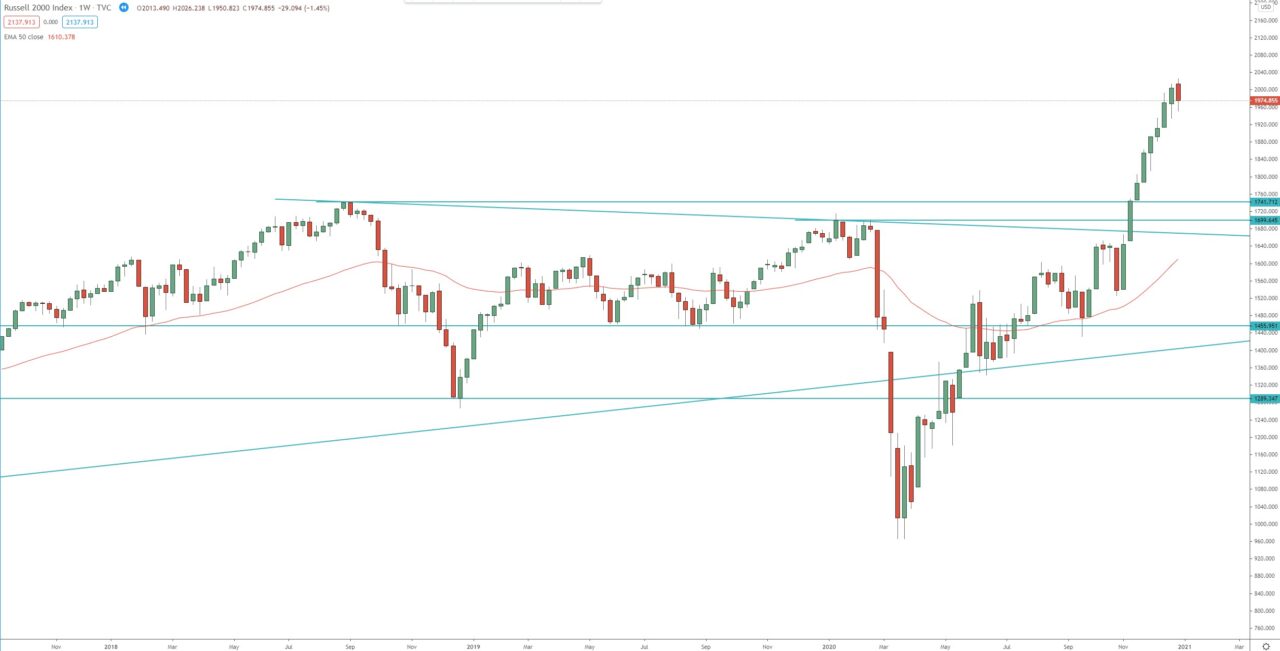
After the initial shock during the COV19 market selloff, the index not only fully recovered but it broke above the pre-pandemic high, thanks to the massive liquidity provided by the FED and numbers stimulus packages from Congress.
Looking at the monthly chart we can see that after the break out above the 2007 and 2011 highs/resistance, the index accelerates to the upside. The first target of this break out is at 1.272 FIB extension around 2150, the second target is at 1.618 FIB extension around 2500. The index is attempting to break above this dynamic resistance, part of this ascending price channel and that encouraging for the bulls.
The weekly chart is within its 3rd bullish wave, the first target of this wave is at 1.272 FIB extension around 2080, the second target is at 1.618 FIB around 2280.
Monthly chart:

Weekly chart:


