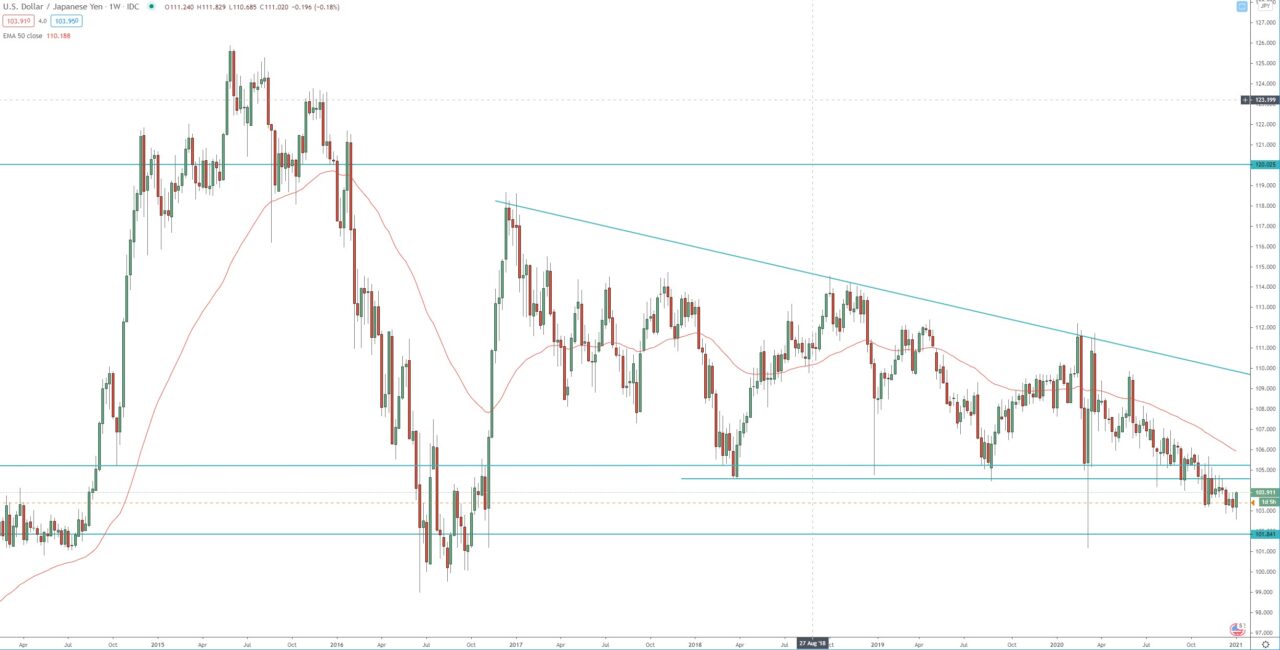
On the weekly chart the price broke below important support and descending triangle. That support is now resistance between 104.50 – 105.50 and must be watched for rejection and resumption of the bearish trend toward 101.00 support.
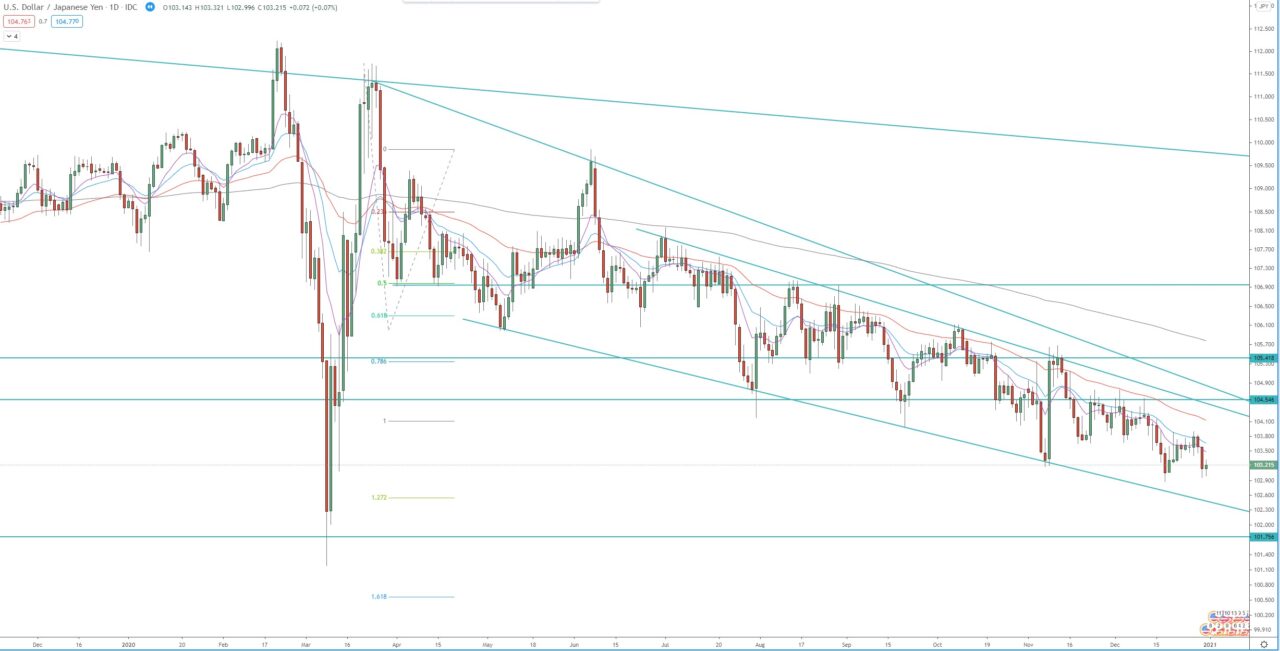
The daily chart is within 3rd bearish wave, the first target of this bearish wave is at 1.272 FIB extension around 102.60, the second target is at 1.618 FIB extension around 100.55.
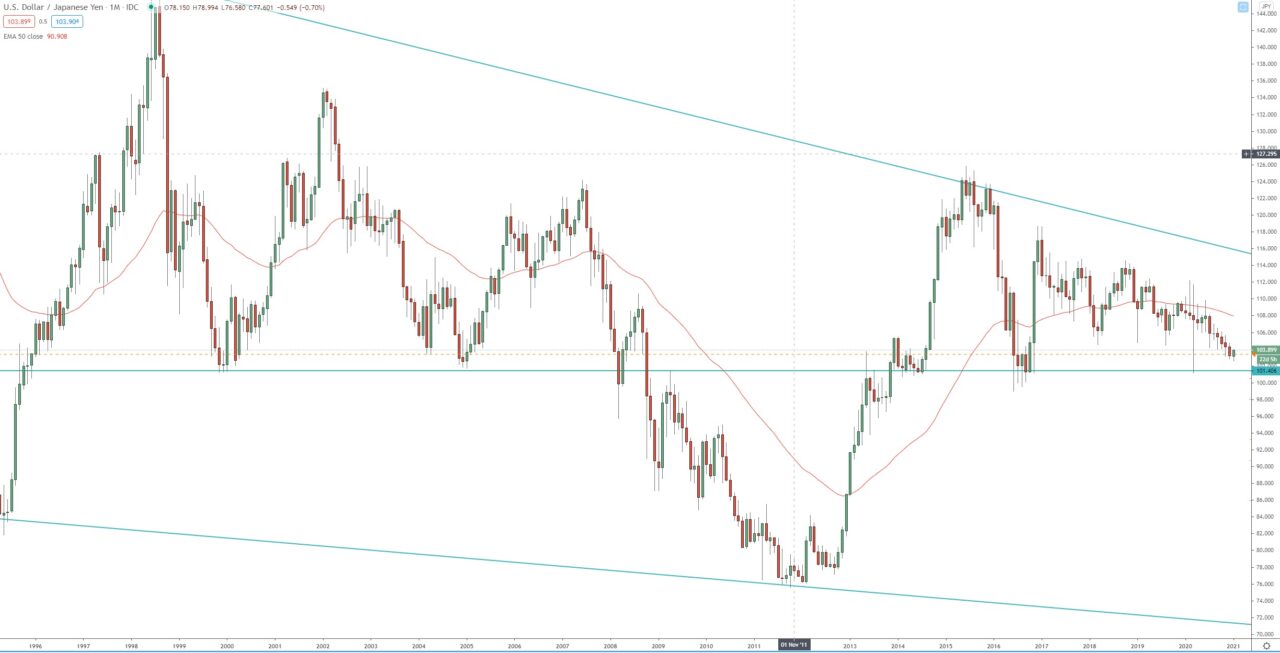
Key support is around 100.00, if we see break below, and sustainable trade below, we may witness big shift in the sentiment.
Monthly chart:

Weekly chart:

Daily chart:


