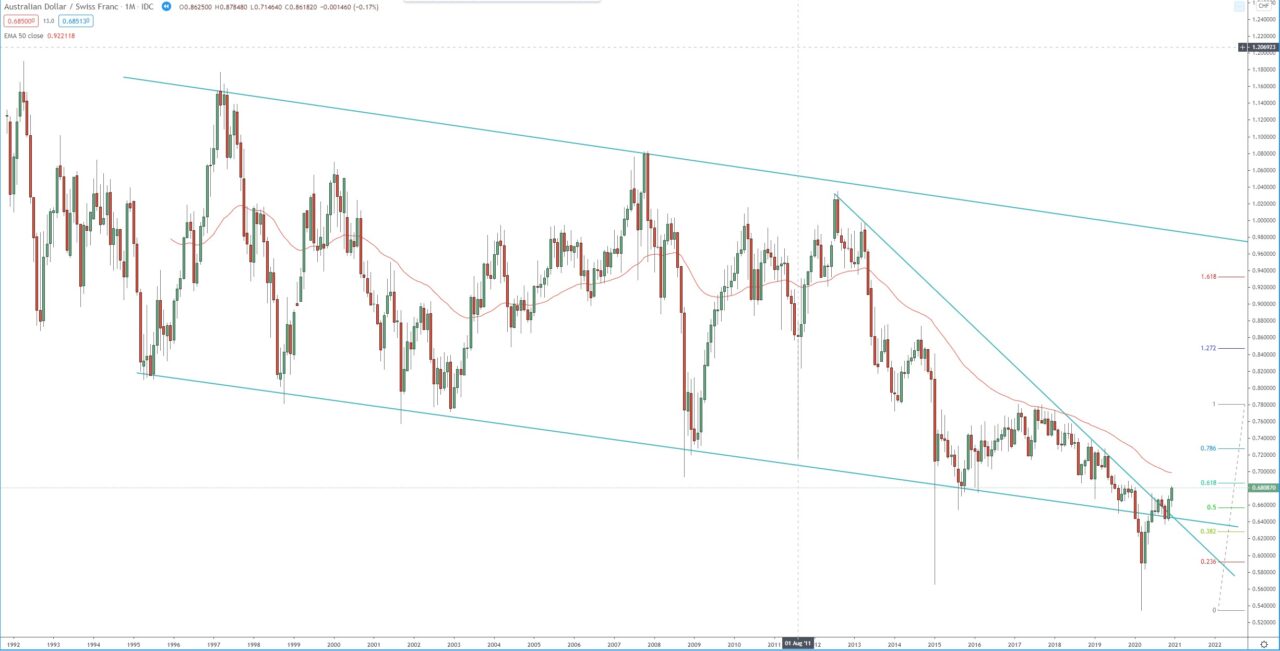
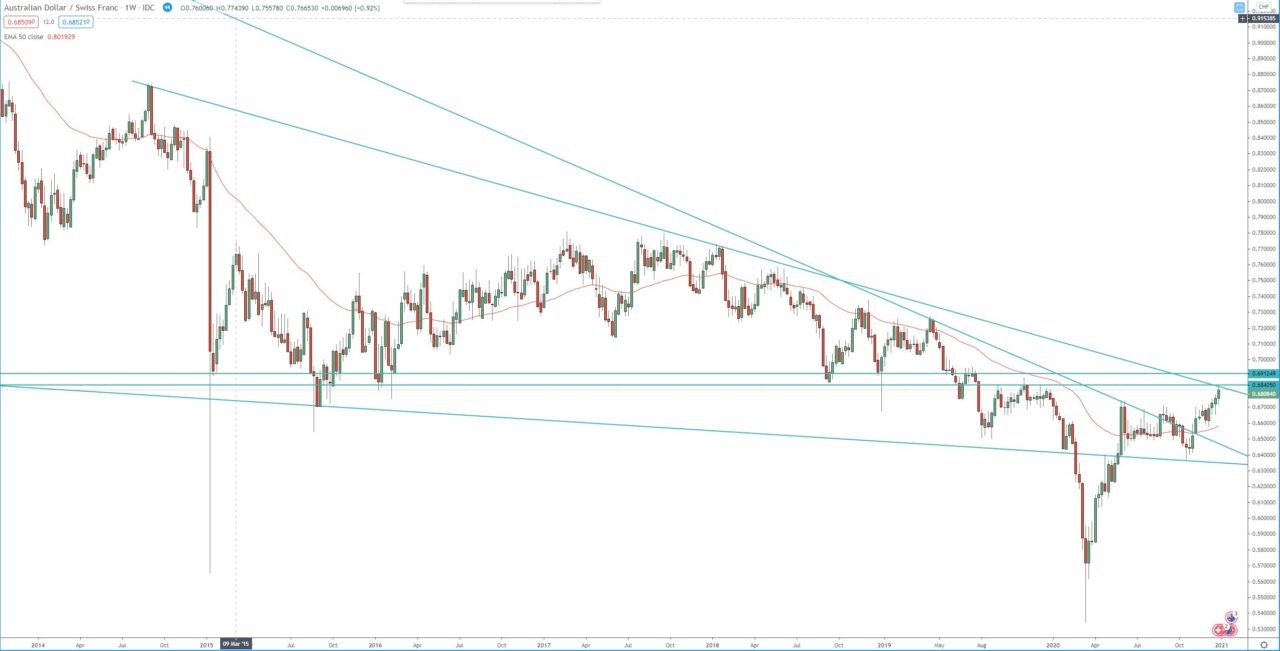
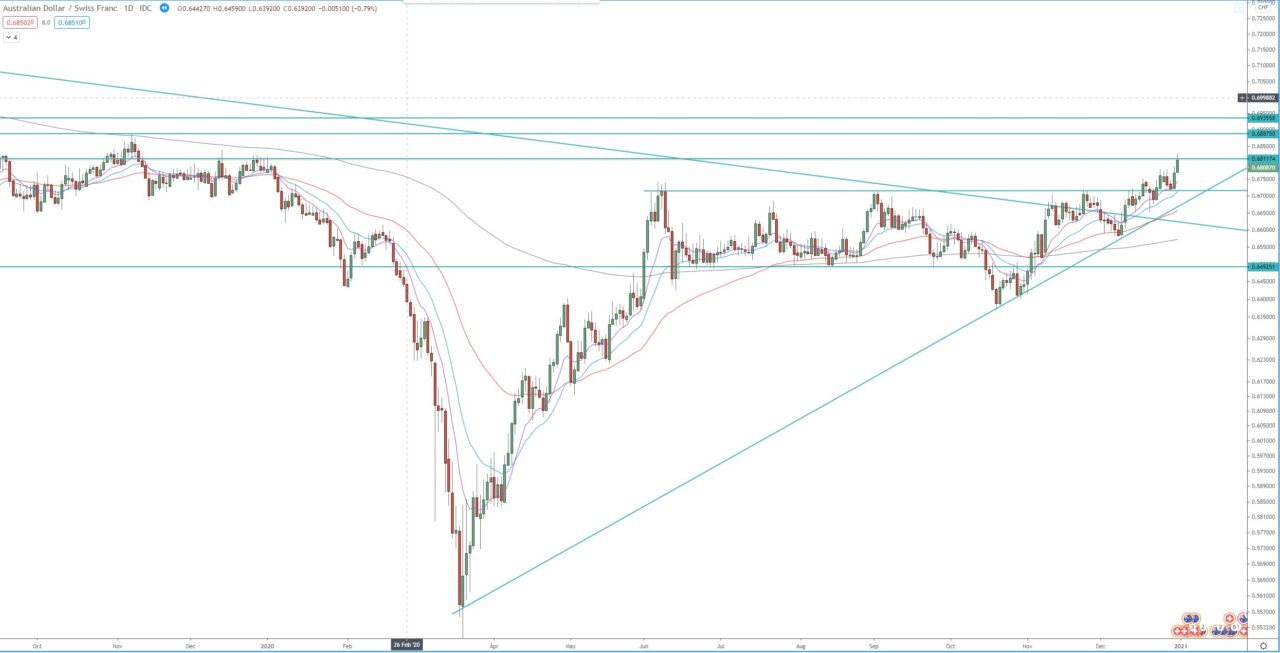
During the volatility in the beginning of the COV19 pandemic the pair briefly broke below 2015 all-time low, and reached as low as 0.5344. However, the price formed low test candle on the monthly, weekly and the daily charts. Eventually that led to break to the upside and beginning on a bullish trend on the monthly, weekly and the daily chart.
The weekly chart is within its 3rd bullish wave, the first target of this wave is at 1.272 FIB extension around 0.8150. Before that the pair is facing strong resistance between 0.6900 – 0.7000, we need to see break above that to confirm this bullish view.
The daily chart is within its 3rd, the first target of that wave is the 1.272 FIB extension around 0.6640 and it was already reached, the second target is at 1.618 FIB extension around 0.6850. If the price break above 0.6850 it will first face strong resistance zone between 0.6900 – 0.7000 and then if we see a break above, it will target the 2.272 FIB extension around 0.7270.
Monthly chart:

Weekly chart:

Daily chart:


