|
Getting your Trinity Audio player ready...
|
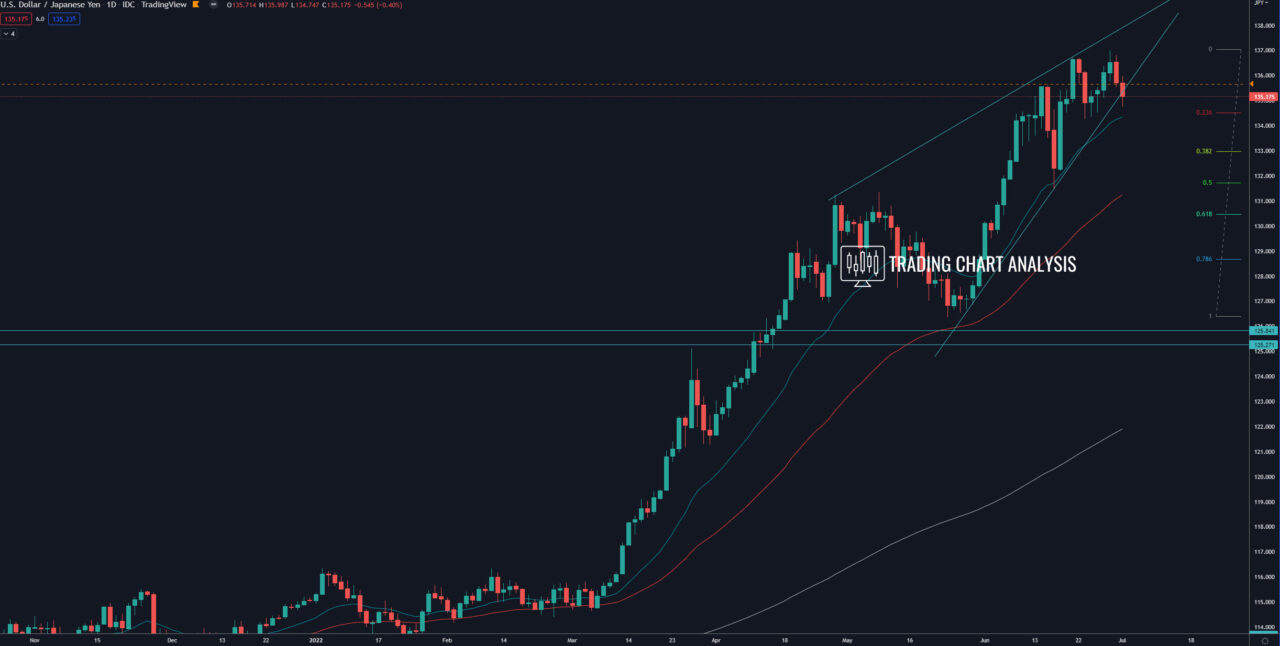
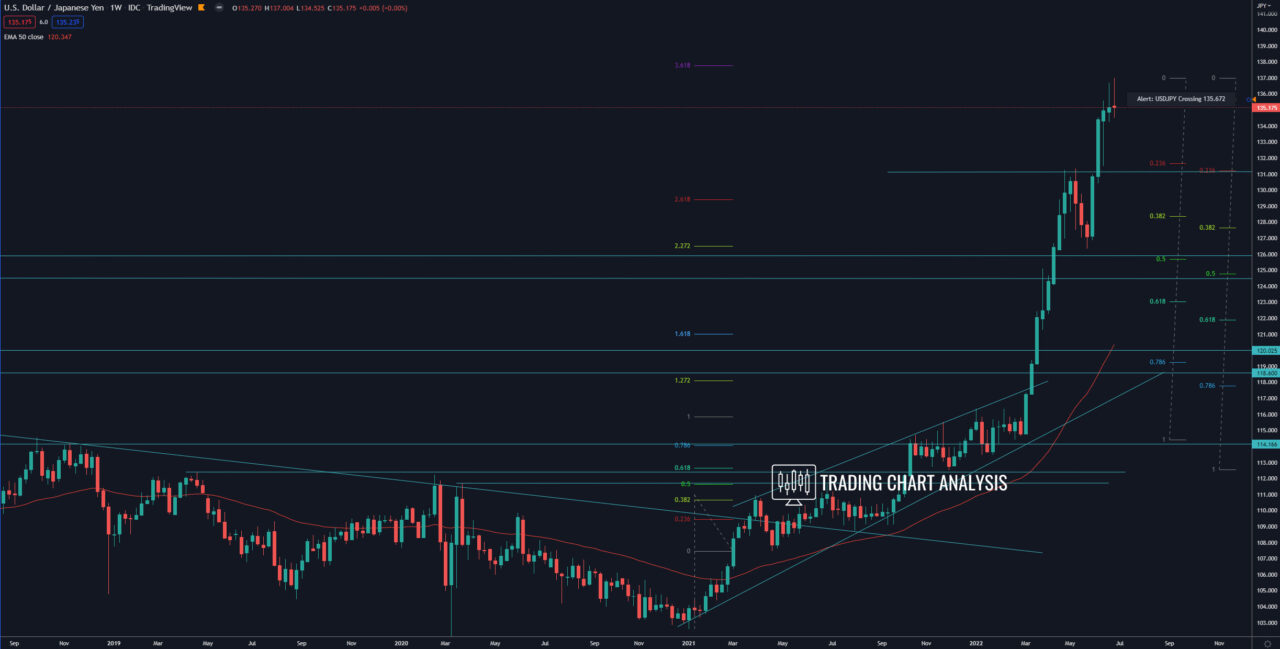
USD/JPY technical analysis, the pair rejected a resistance zone with tweezers top on the weekly chart and a double top on the daily chart, starting a pullback. The first target for this pullback is the 0.382 FIB retracement on the daily chart at 133.00. The second target for the USD/JPY pullback is the previous low on the daily chart at 131.50. The third target is the 0.618 FIB retracement on the daily chart at 130.50.
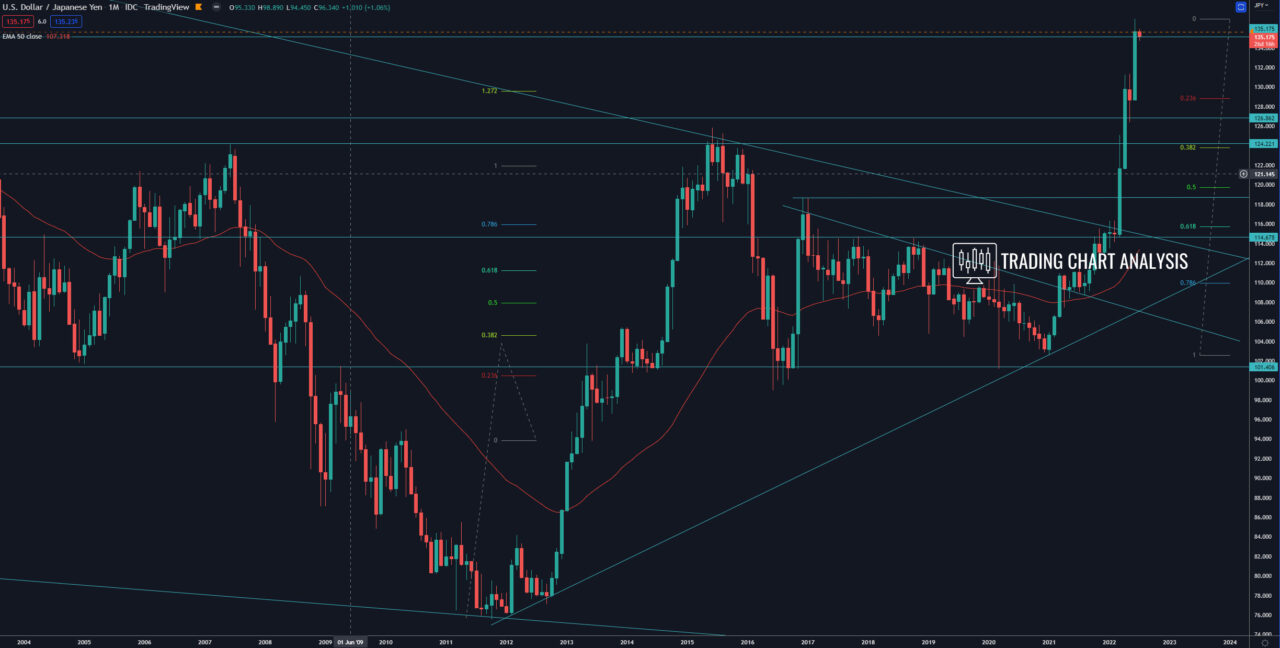
Looking at the bigger picture, the USD/JPY is in its third bullish wave on the monthly chart. The second target for this bullish wave is the 1.618 FIB extension at 139.35. Therefore when the USD/JPY pair breaks above the double tops on the daily chart it will clear the way for a bullish run toward 139.35.
Daily chart:

Weekly chart:

Monthly chart:


