|
Getting your Trinity Audio player ready...
|
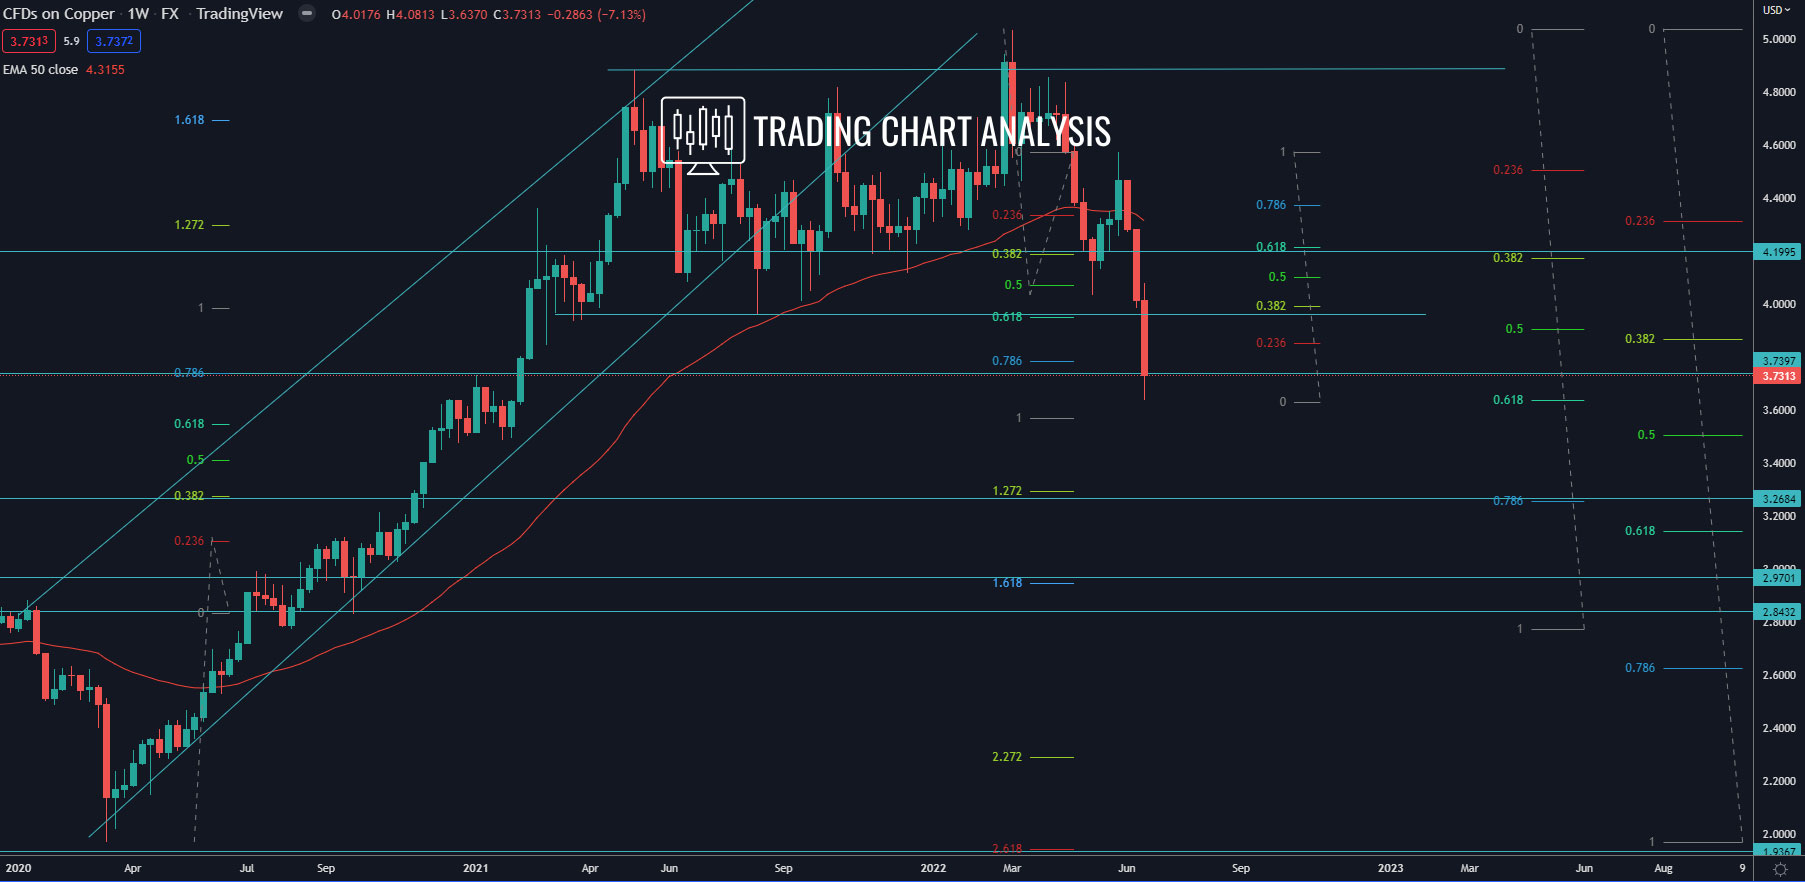
Technical analysis for Copper, the price broke down on the weekly chart, starting a bearish run. The first target for this bearish run is the 0.618 FIB retracement on the weekly chart at 3.65$ was reached. The second target is the 0.618 FIB retracement on the monthly chart at 3.15$. The third target for the bearish run for Copper is the 1.618 FIB extension on the weekly chart at 2.95$.
The resistance zone between 3.95$ and 4.20$ will be watched by traders for rejection and resumption of the bearish pressure in the Copper price.
Weekly chart:
Monthly chart: