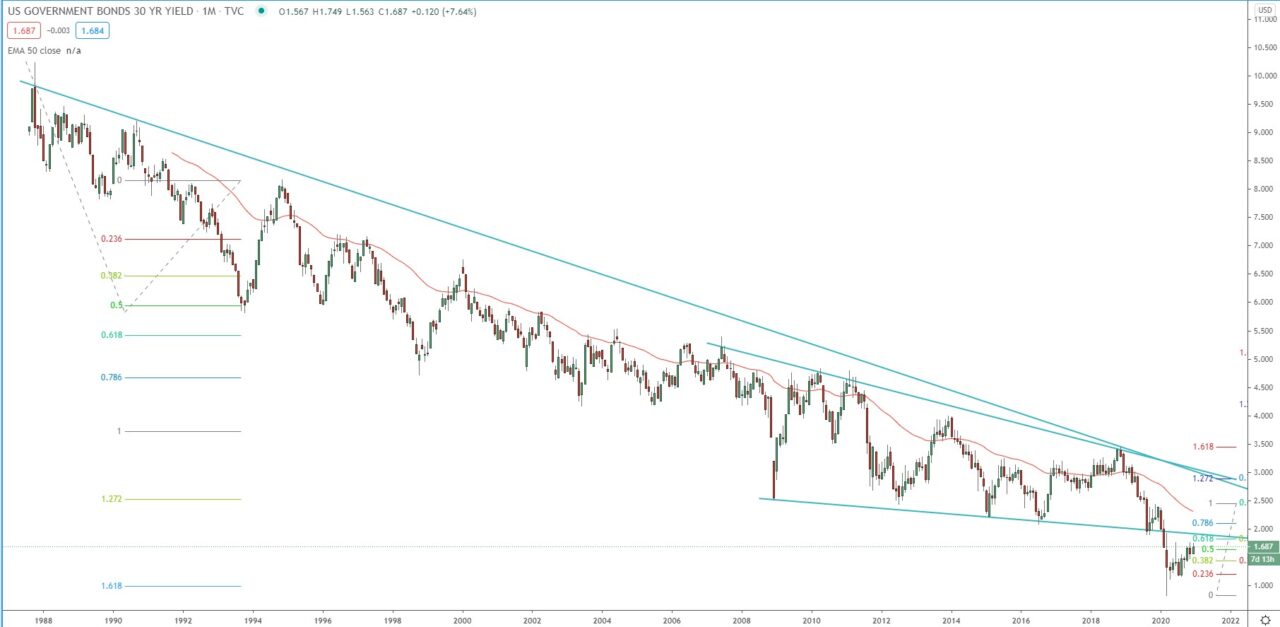
The decline in the 30-year bond accelerated in January 2020, because of the COV19 pandemic and the FED fast interest rate cuts, and the introduction of several liquidity/loan programs design to support the economy and the business! The bearish momentum was strong enough to broke significant support and break below descending wedge, as we can see below on the monthly chart. However, the decline reached a 1.618 FIB extension, the second target for the 3rd wave of the bearish monthly trend.
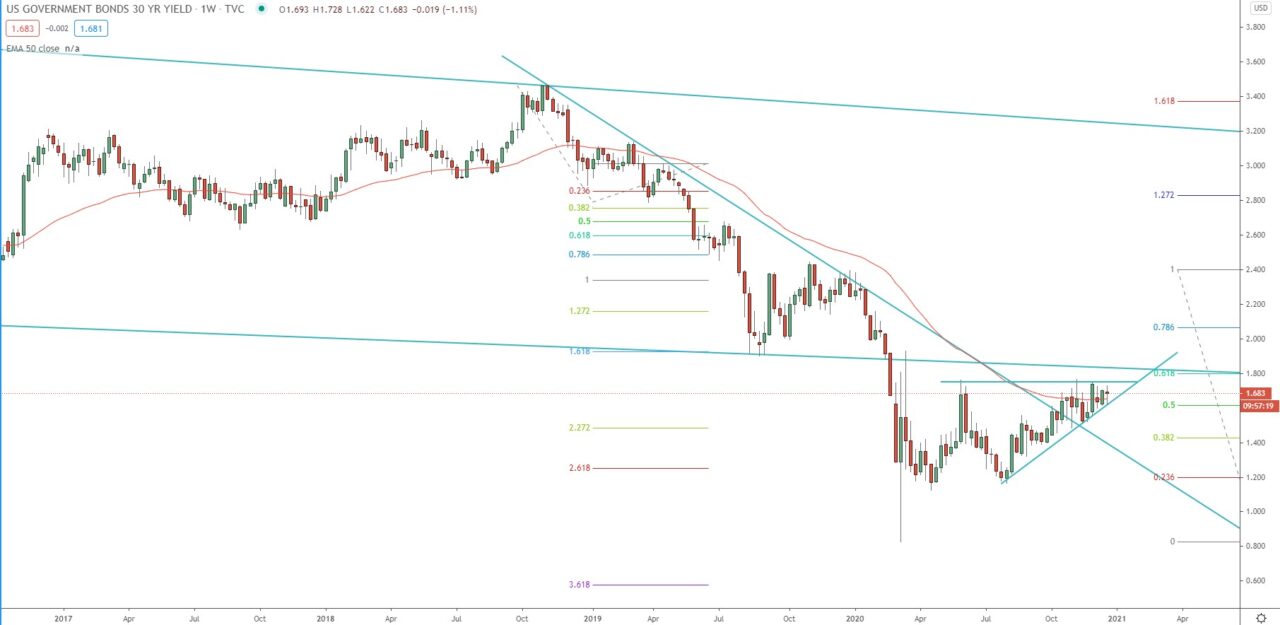
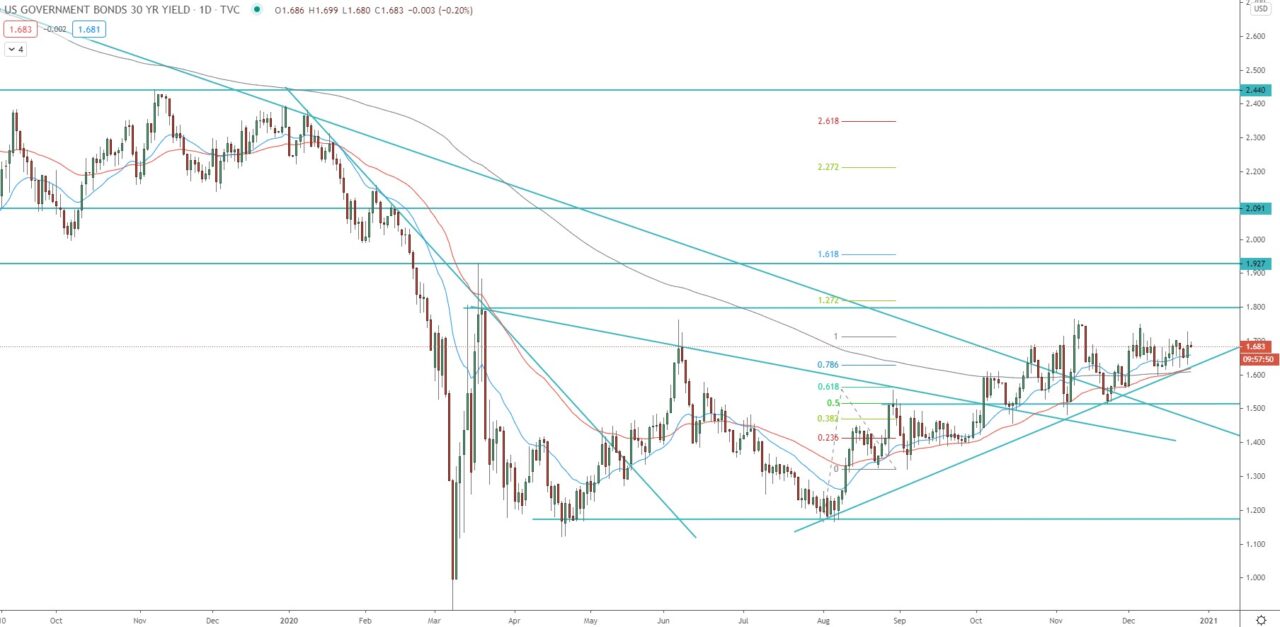
Now the price is consolidating in a range/ascending triangle on the daily/weekly chart, that consolidation broke above dynamic resistance, which was forming since 2018. Therefore, if the price break above the previous weekly double tops, top of the triangle, resistance, and 0.618 FIB (above 1.765) we should see further upside toward, first March 2020 highs, around 1.93 – 1.95, and second toward February 2020 around 2.15 and eventually toward December 2019 around 2.39 – 2.40.
The expectation for economic growth after 2020/2021 winter, and hopefully with COV19 vaccination rollout quickly, expectations are that we will see economic recovery in the Spring of 2021, and economic expansion in the summer of 2021, when the peoples will get back to traveling and will resume their pre-pandemic activity! The FED is not be going to tapering their QE program in the first half of the year, but perhaps it will reduce their bond purchasing program in the second part of 2021, and that should be supportive for the 30 and 10-year US bond yield.
Monthly chart:

Weekly chart:

Daily chart:


