|
Getting your Trinity Audio player ready...
|
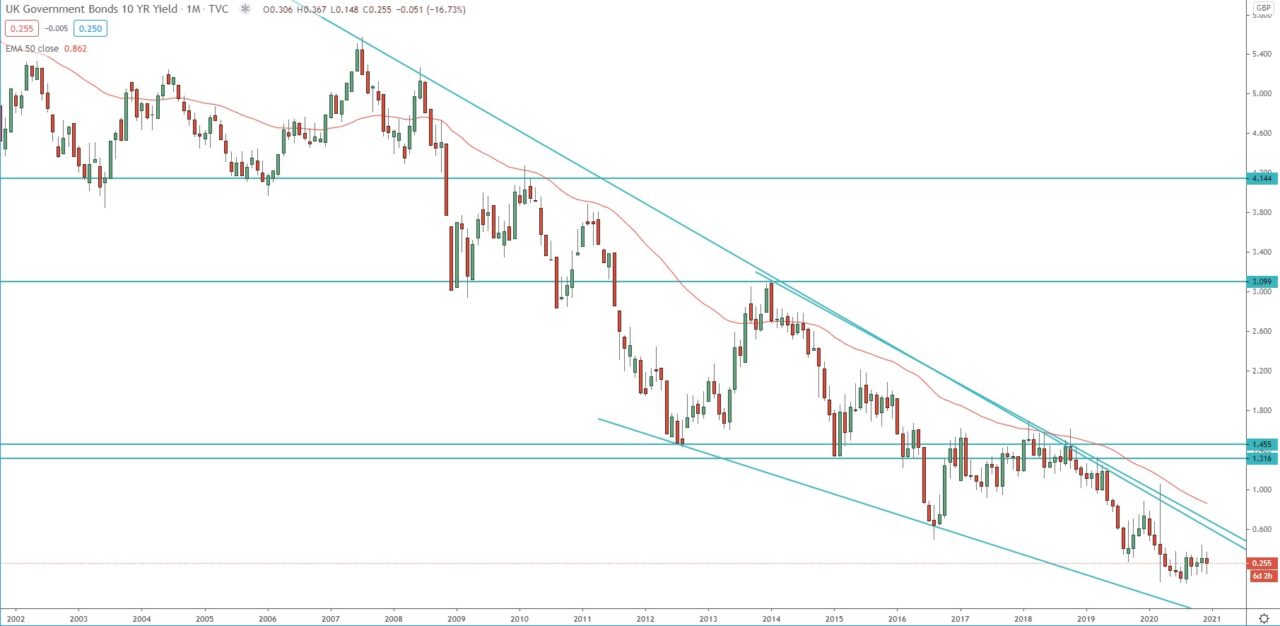
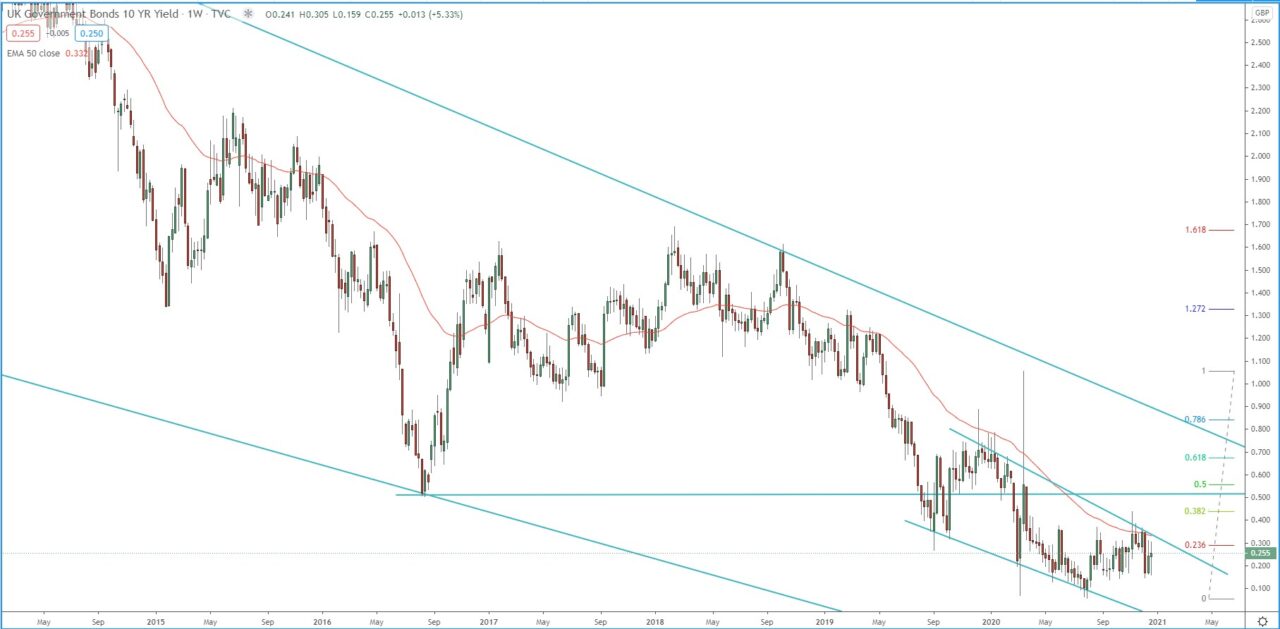
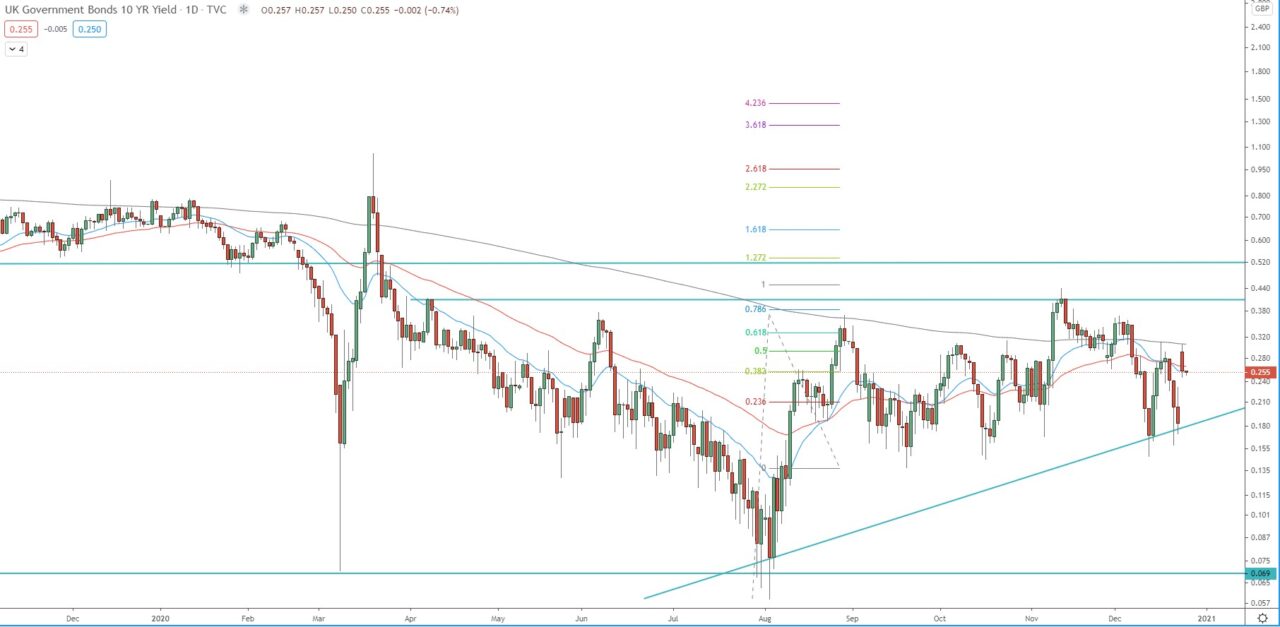
The price action is still bearish on all timeframes. However, the weekly chart is in a range between 0.141 – 0.364, if the price break above this range and the weekly 50 EMA we should see further upside first toward 0.444 and second toward 0.520. If we see a break and hold above 0.520, we may see a significant bullish moment toward, first 0.675 (0.618 FIB), second toward December 2020 high around 0.755, then 1.00, and if we see a break above 1.00 we should see a further bullish move toward the strong resistance between 1.300 – 1.455.
Monthly chart:

Weekly chart:

Daily chart:


