technical analysis for 2021
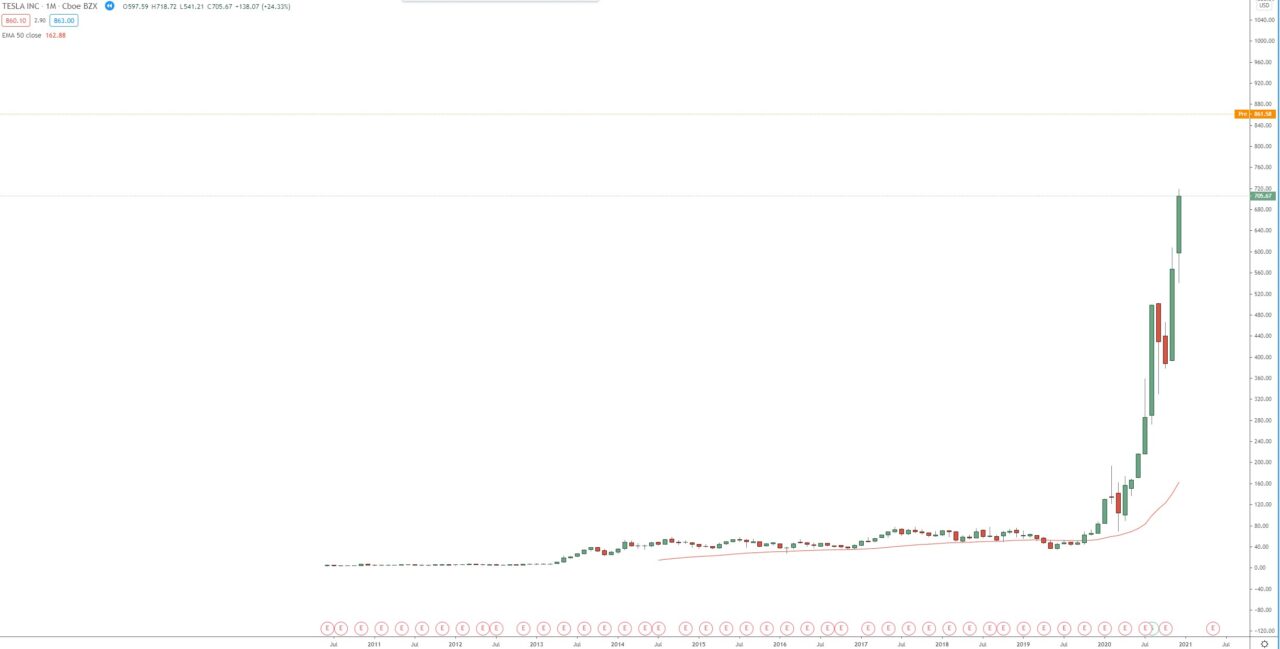
During the last 10 months the price moved parabolically, which is always a warning sign. The monthly chart is within its 3rd bullish wave. The first target of that wave is at 1.272 FIB extension around 925. Second target is at 1.618 FIB extension around 1090.
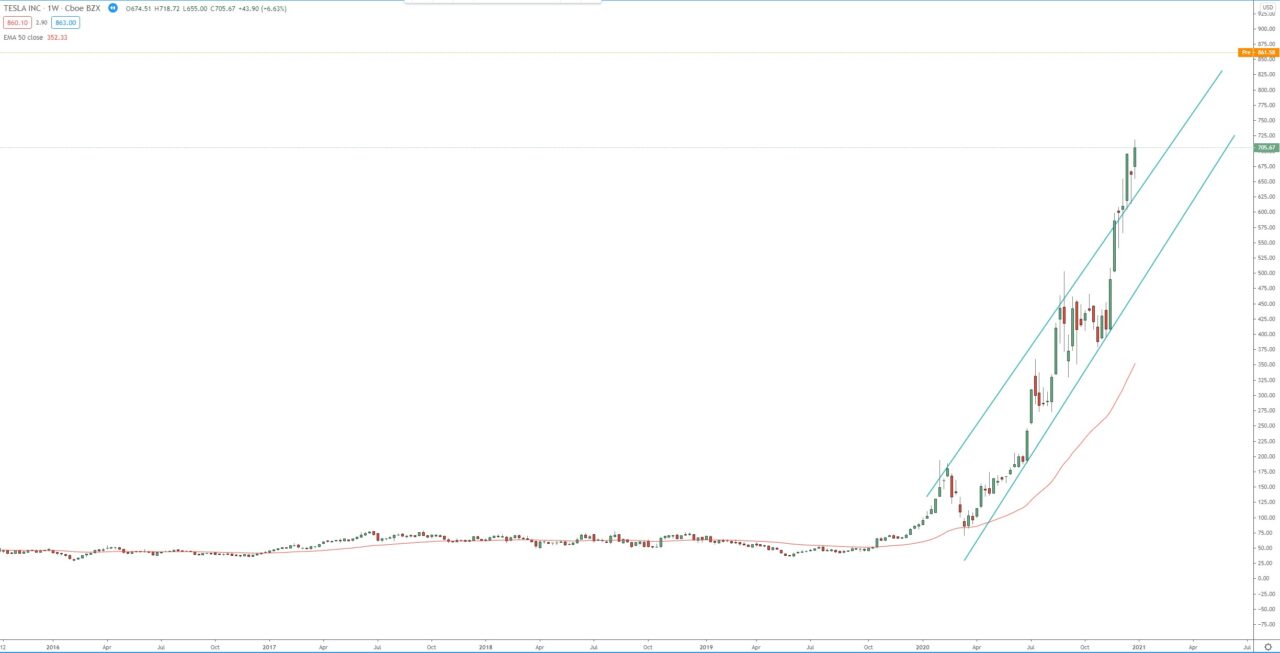
The weekly chart is within its 5th bullish wave, that was confirmed with the break out in November 2020. The first target of that wave was already reached at 0.618 FIB extension around 600. The second target is at 100% FIB extension around 765.00. if we see break above that next will be the 1.272 FIB extension around 930.
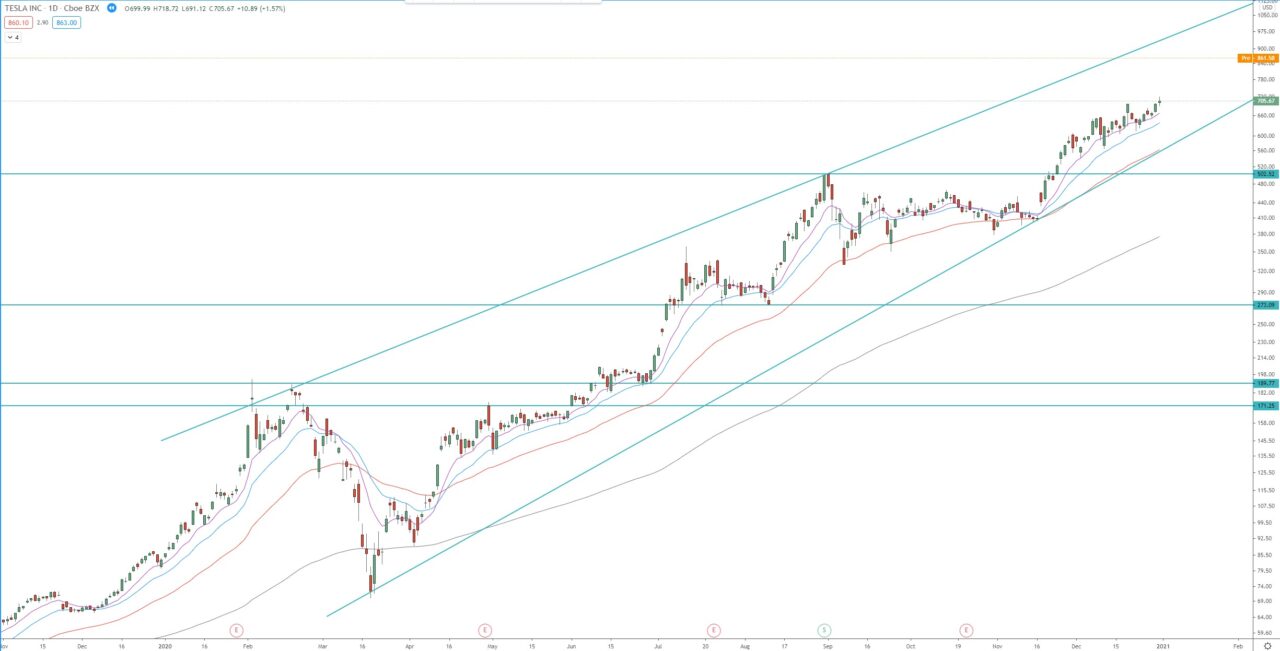
Daily chart is forming ascending wedge, we must monitor this pattern, because, break below it will trigger the next sizable correction/pullback in the Tesla stock price.
Monthly chart:

Weekly chart:

Daily chart:


