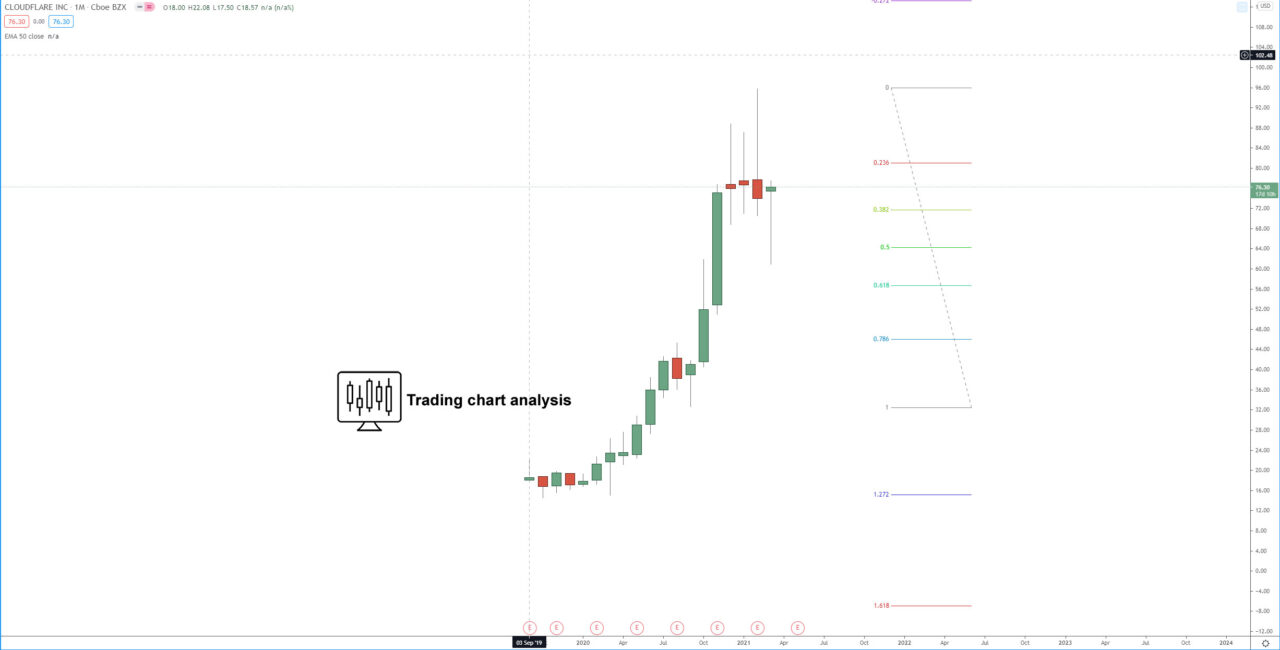
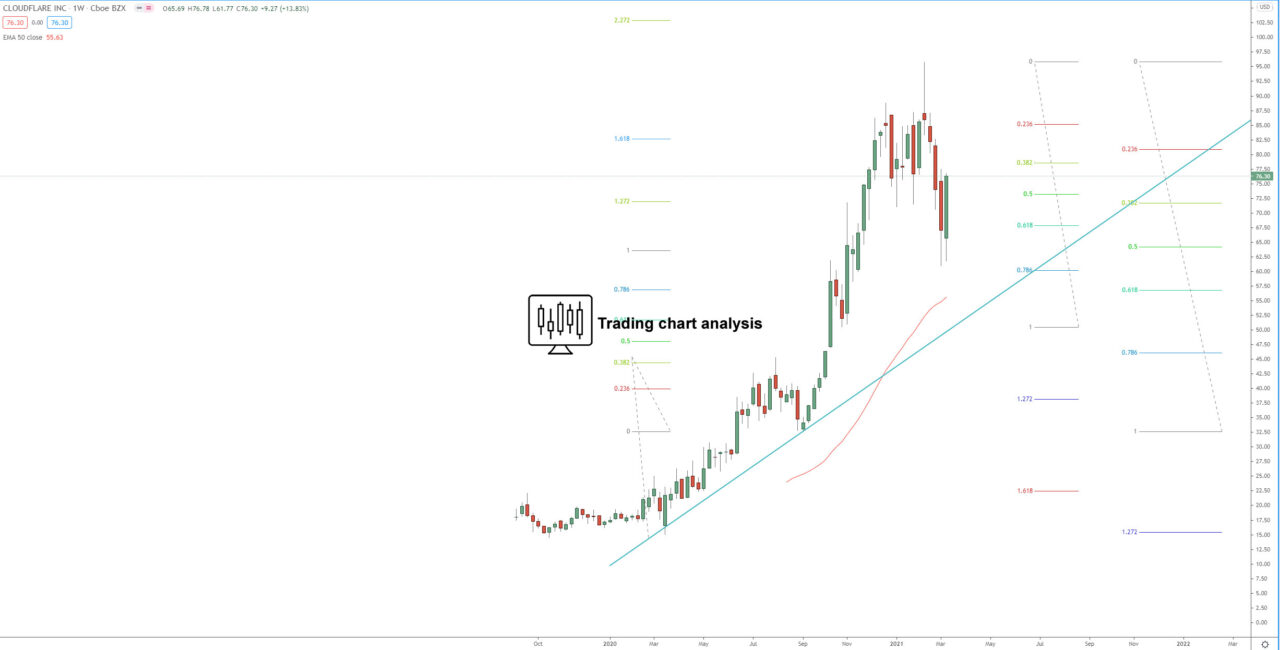
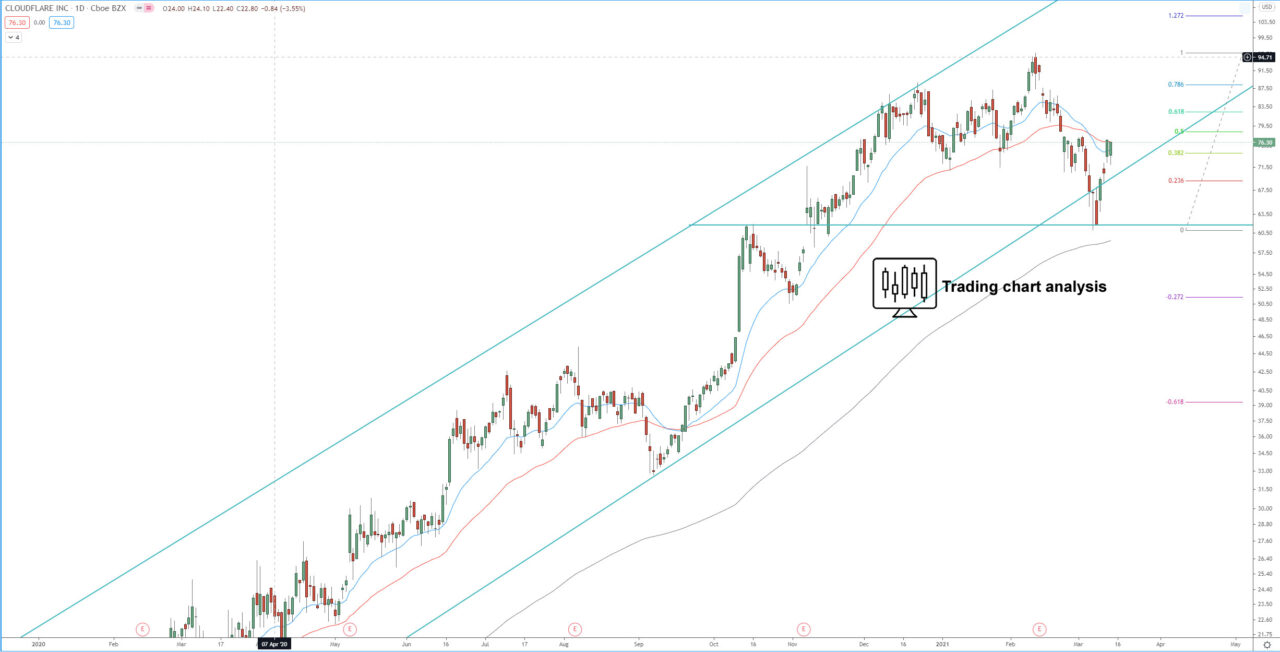
The shares are within their 3rd bullish wave on the weekly and the monthly chart. The price reached and exceeded the first target of the bullish wave, at 1.618 FIB extension around 82.50, reached as high as 95.77, and started a pullback. This pullback started with a tweezer tops pattern on the monthly chart and a high-test candle on the weekly chart, and it is shaping to be an ABC pullback on the daily chart. The first target of the daily pullback is at 0.618 FIB extension around 61.80, and it was reached.
The price went as low as 61.05 and bounced from the October 2020 high, forming double bottoms on the 1H chart. If the price break above 77.50, it will be a signal for resumption of the bullish weekly/daily trend, and it will send the price toward, first at 83.30, the 1.272 FIB extension of the 1H bullish run, second toward the 1.618 FIB extension at 87,20 and then toward the previous high at 95.30. If the price break above the previous high at 95.30, it will extend the 3rd bullish weekly/monthly wave and send the price toward the 2.272 FIB extension around 102.80, second 2.618 FIB extension at 113.50.
On the other hand, if the price break below 61.05 it will extend the daily pullback to full breakdown and send the price toward, first 100% FIB extension at 52.30, second at 1.272 FIB extension around 45.50.
The support zone between 52.00-50.55 is an important one, therefore if the price comes near it, it should be monitored for rejection and resumption of the bullish monthly trend.
Monthly chart:

Weekly chart:

Daily chart:


