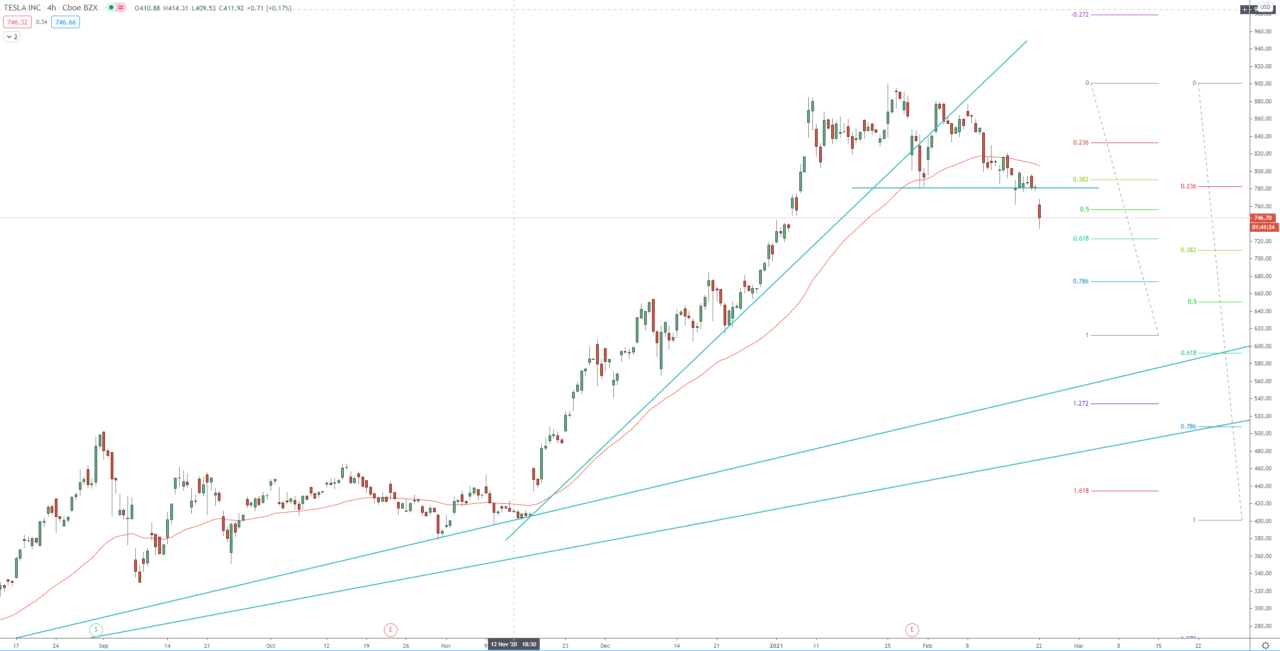
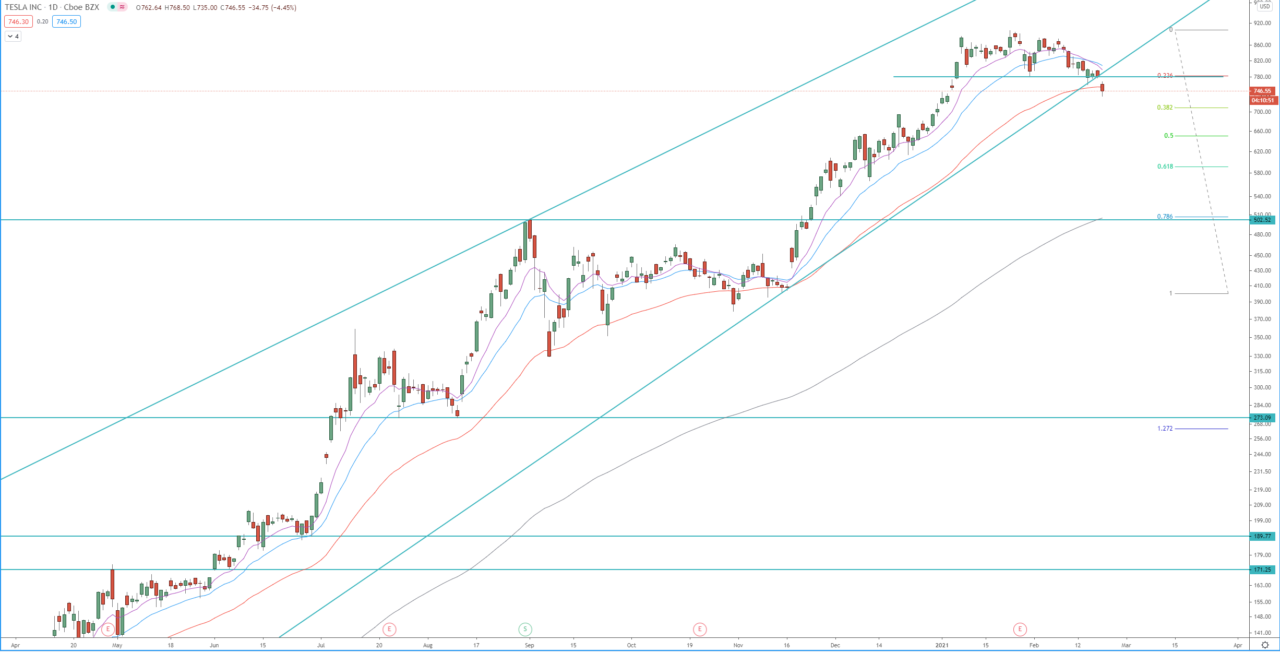
Last week the price briefly broke below the previous low at 780.70 on the 4H chart. This break is a hint for a potential further decline in the shares of Tesla Inc. On Monday, the price opens below that low on the 4H and the daily charts and breaking below ascending trend line part of an ascending wedge on the daily chart. The first target of this 4H bearish run is at 1.272 FIB extension around 725, the second target is at 1.618 FIB extension at 685. If the price breaks below 685, it may accelerate the decline and send the price toward 565. However, before that, we need to see a break below the daily 50 EMA and further price action on the daily chart.
Review our 2021 technical analysis for Tesla Inc. shares.
4H chart:

Daily chart:


