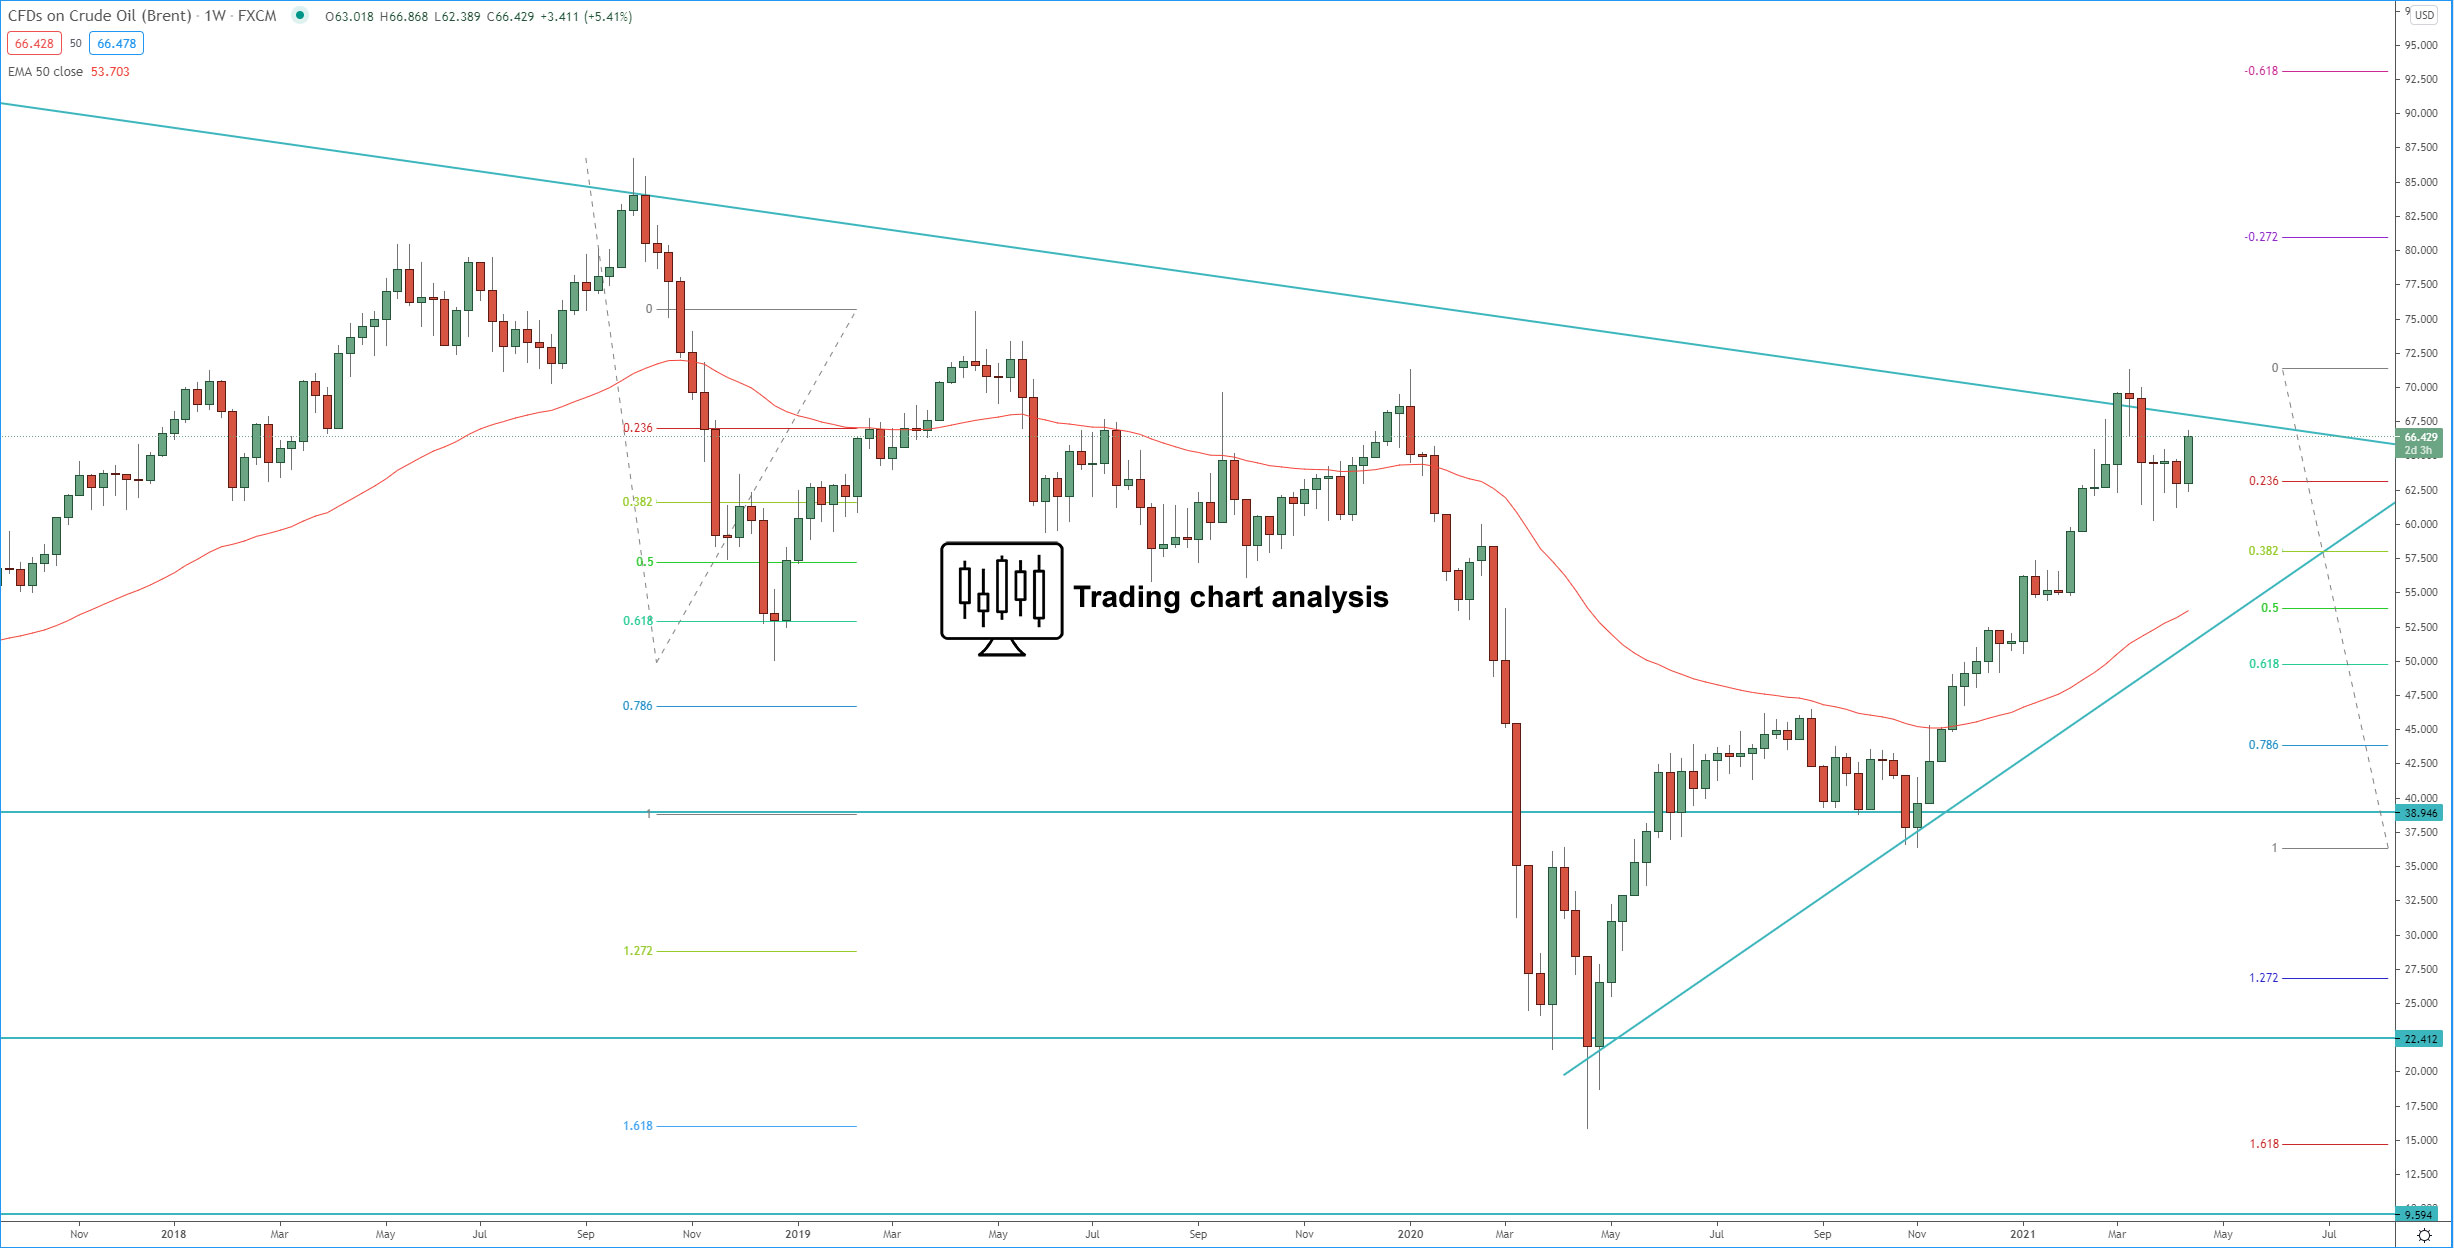
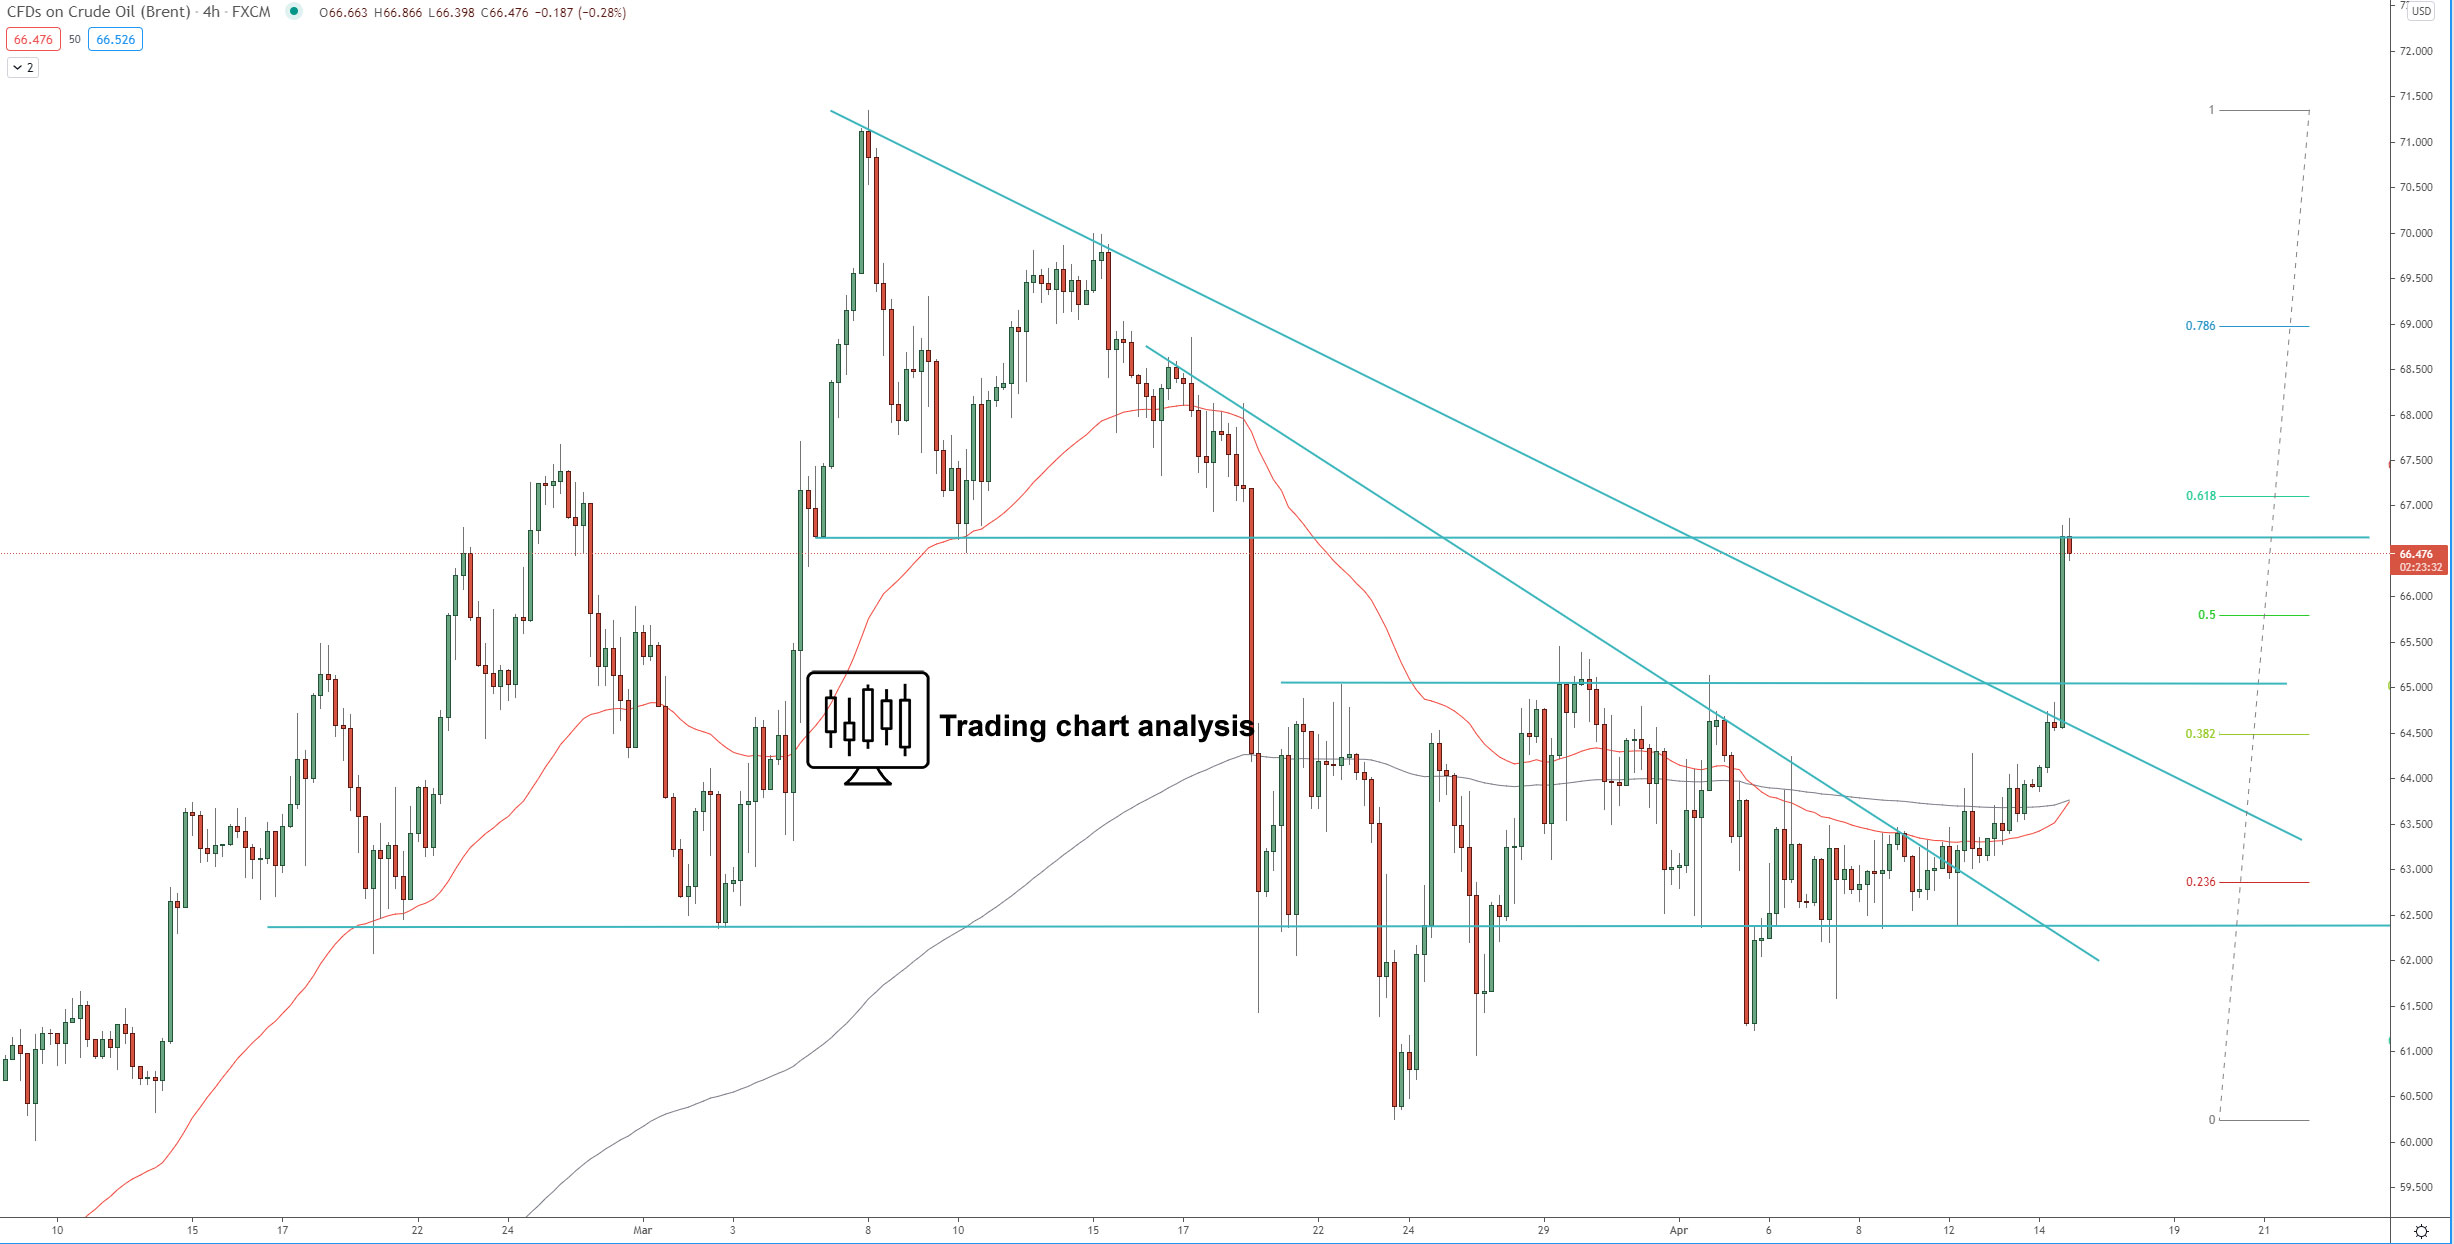
Technical analysis for Brent Crude Oil is showing that the price formed tweezers bottom on the weekly chart and breakout three weeks range to the upside, a signal for further upside potential. The first target of this breakout is at 0.618 FIB retracement at 67.10$, the second target is at 1.272 FIB extension at 67.90$, and the third target is at 1.618 FIB extension at 69.70$. If the price break above 69.70$, it will send Brent Crude Oil higher, toward the previous daily high at 71.34$.
If this bullish momentum in Brent Crude Oil breaks above 71.34$, it will resume the bullish weekly trend and send the price higher toward the 1.272 FIB extension at 75.25$, break above 75.25$ it will send the price toward 1.618 FIB extension at 86.00$.
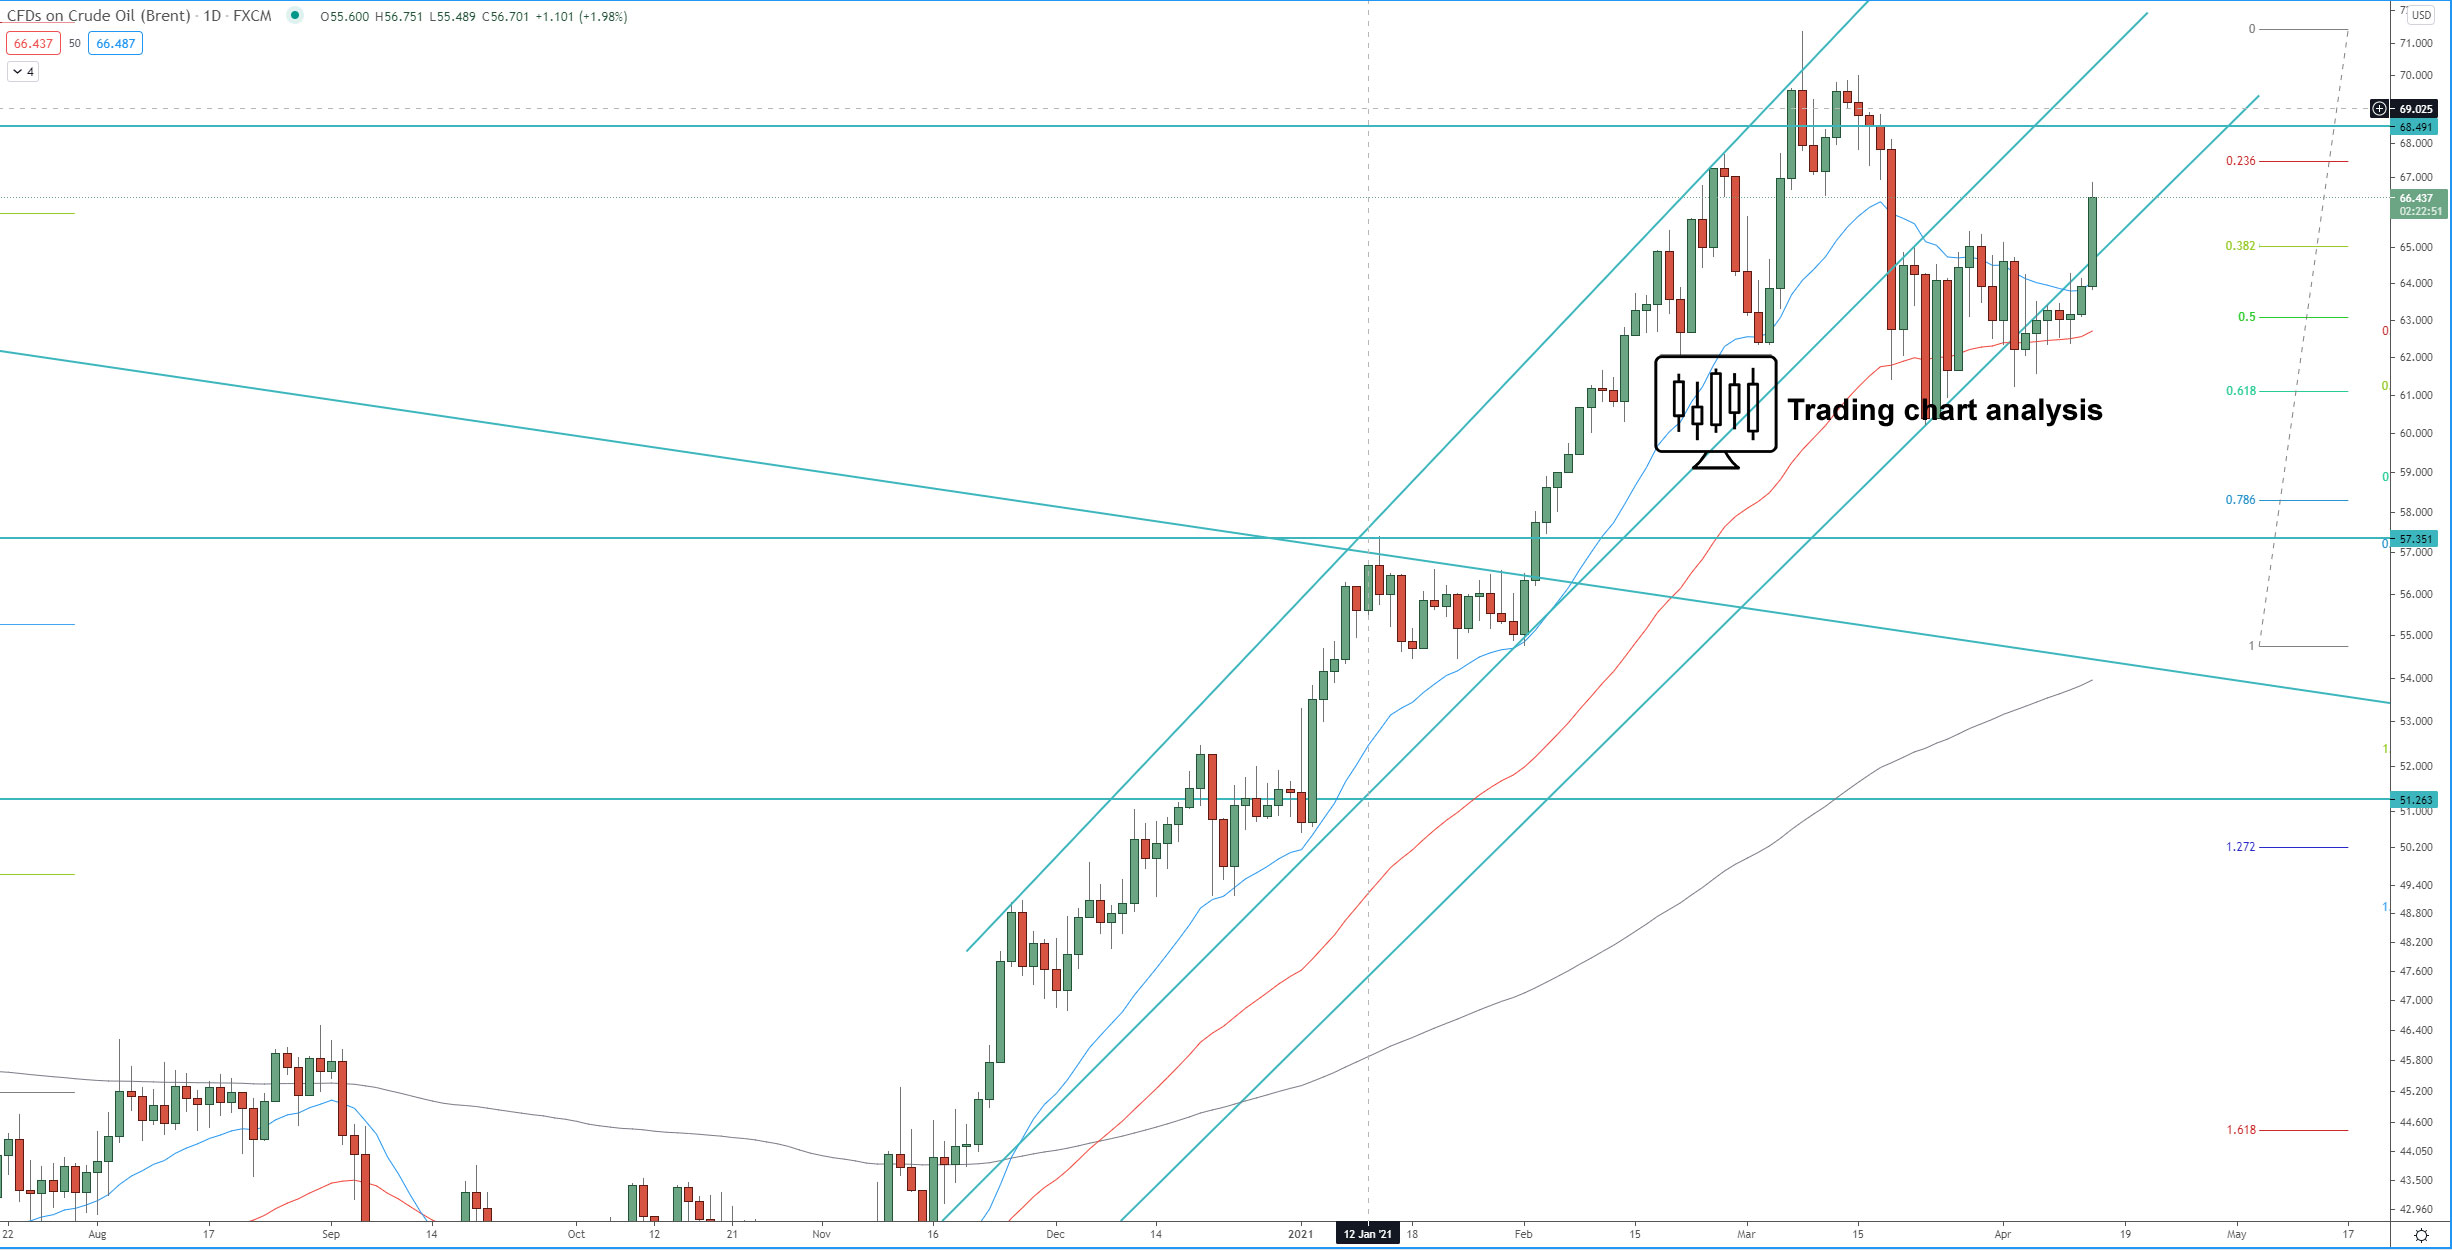
On the other hand, if the price of UK Oil breaks back below 61.20$, it will be a signal for resumption of the daily bearish run and send the price lower toward, first 60.00$, and second toward 0.386 FIB retracement at 58.00$.
Review our technical analysis for Brent Crude Oil pair for 2021 targets.
4H chart:
Daily chart:
Weekly chart: