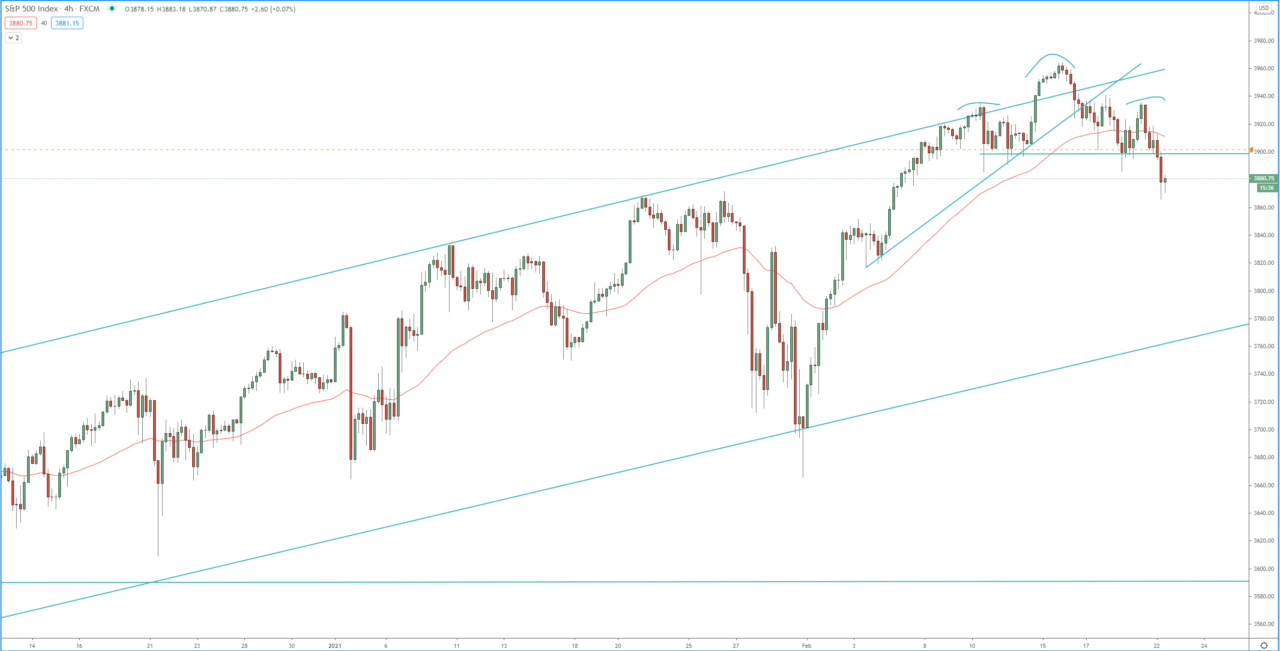
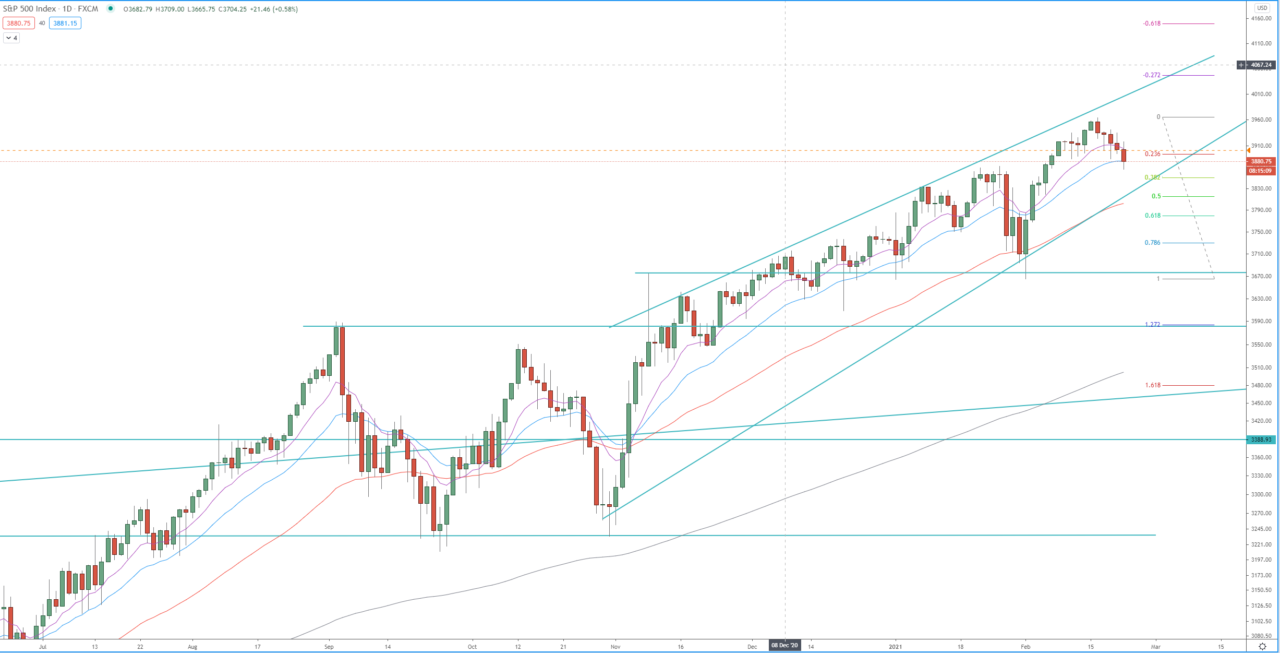
Looking at the 4H chart of the CDF, the price formed Head and Shoulders and broke below the neckline on Monday the 22 February when the futures market opened. This breaks down continues the daily pullback that started last week and confirmed the bearish run on the 4H chart. The first target of the 4H at 1.272 FIB extension around 3830, the second target is at 1.618 FIB extension around 3800. Break below 3800 will be a break below the dynamic daily support (ascending trend line) and may accelerate the sell-off toward 3700.
On the other hand, if the price breaks back above 3935 it will invalidate this 4H bearish run and will resume the bullish daily trend and send the price back toward the previous high around 3965.
4H chart:

Daily chart:


