|
Getting your Trinity Audio player ready...
|
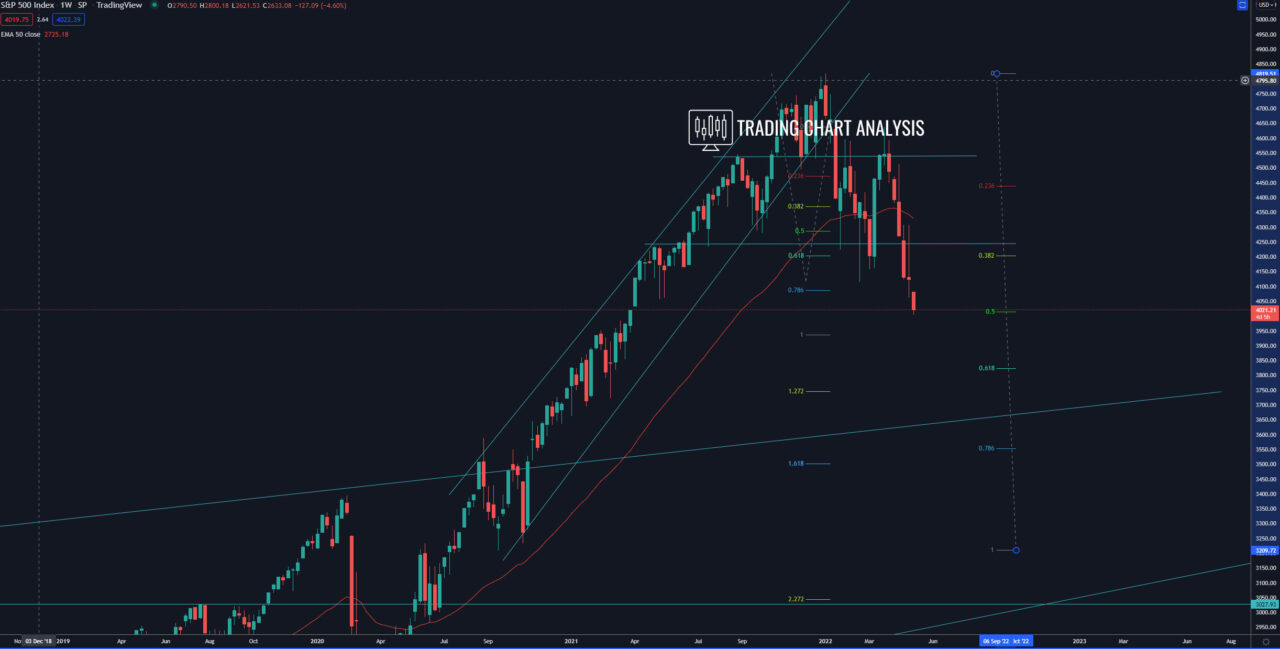
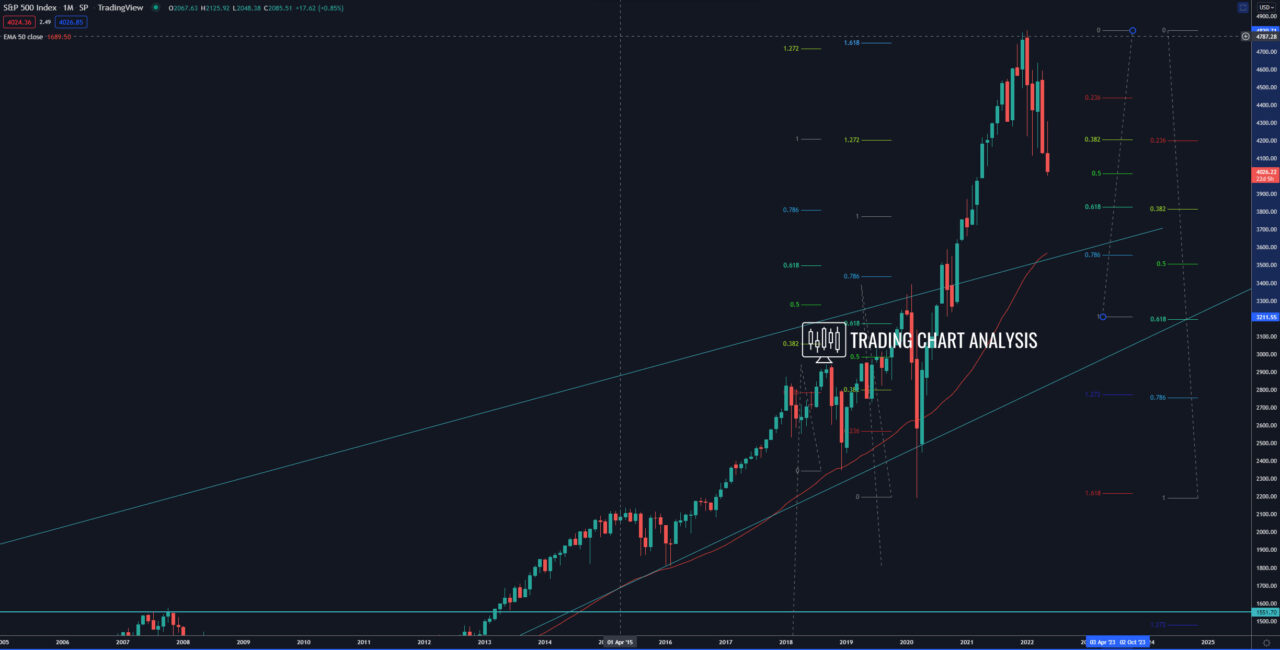
Technical analysis for S&P 500, the index closed below the 0.382 FIB retracement on the weekly chart and broke below the neckline of a Head & Shoulders pattern on the weekly chart, starting a bearish wave on the weekly chart. The first target for this bearish wave of the S&P 500 is the 0.618 FIB retracement on the weekly chart and the 0.382 FIB retracement on the monthly chart around 3820. The second target is the 1.272 FIB extension on the weekly chart at 3750. The third target for the bears is the 1.618 FIB extension on the weekly chart at 3500. However, we need to see the index S&P 500 closing below 4000.
On the other hand, in case that the index S&P 500 reject the 4000 level, all eyes are on the resistance around 4300.
Weekly chart:

Monthly chart:


