|
Getting your Trinity Audio player ready...
|
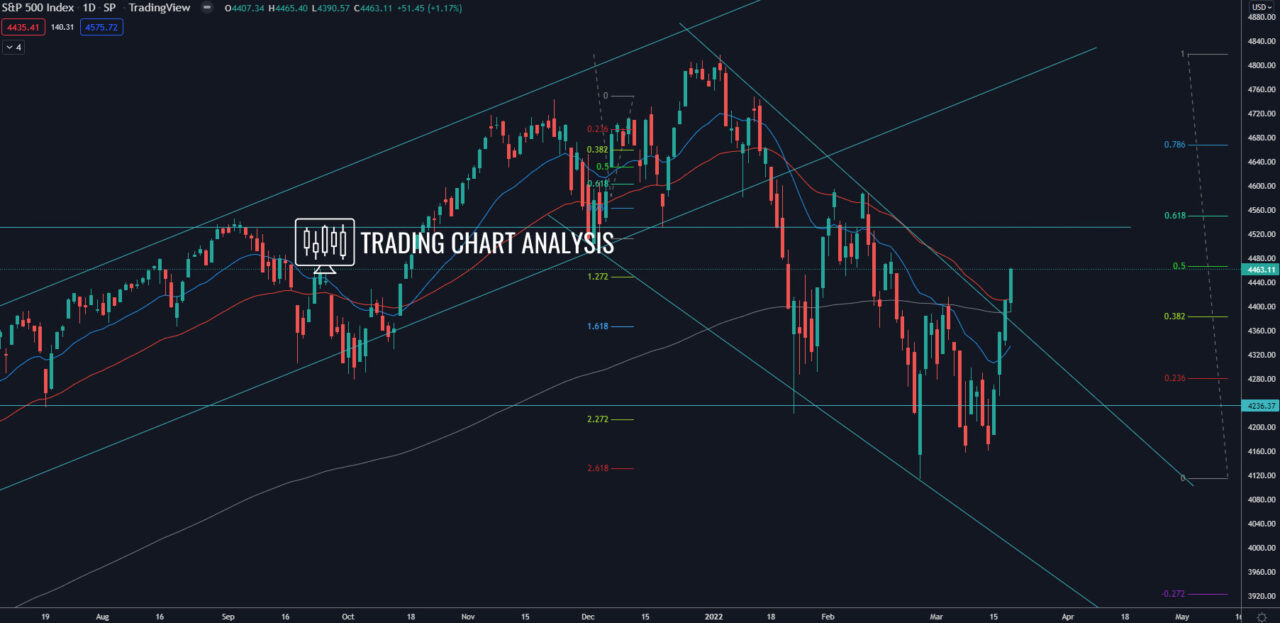
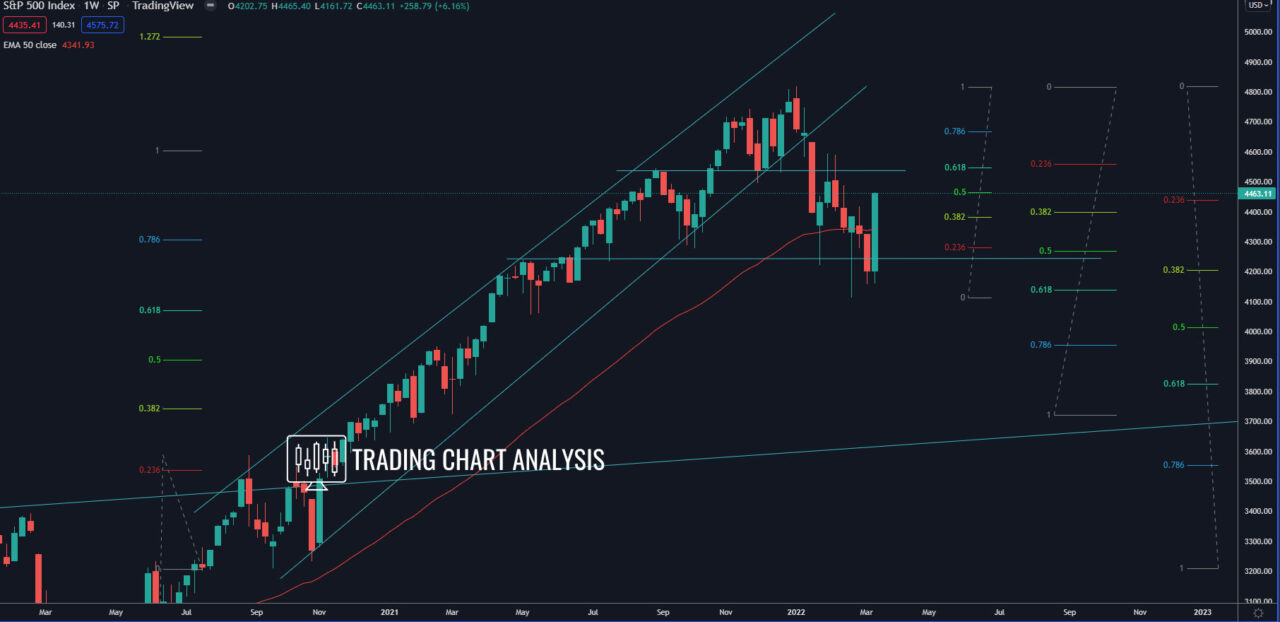
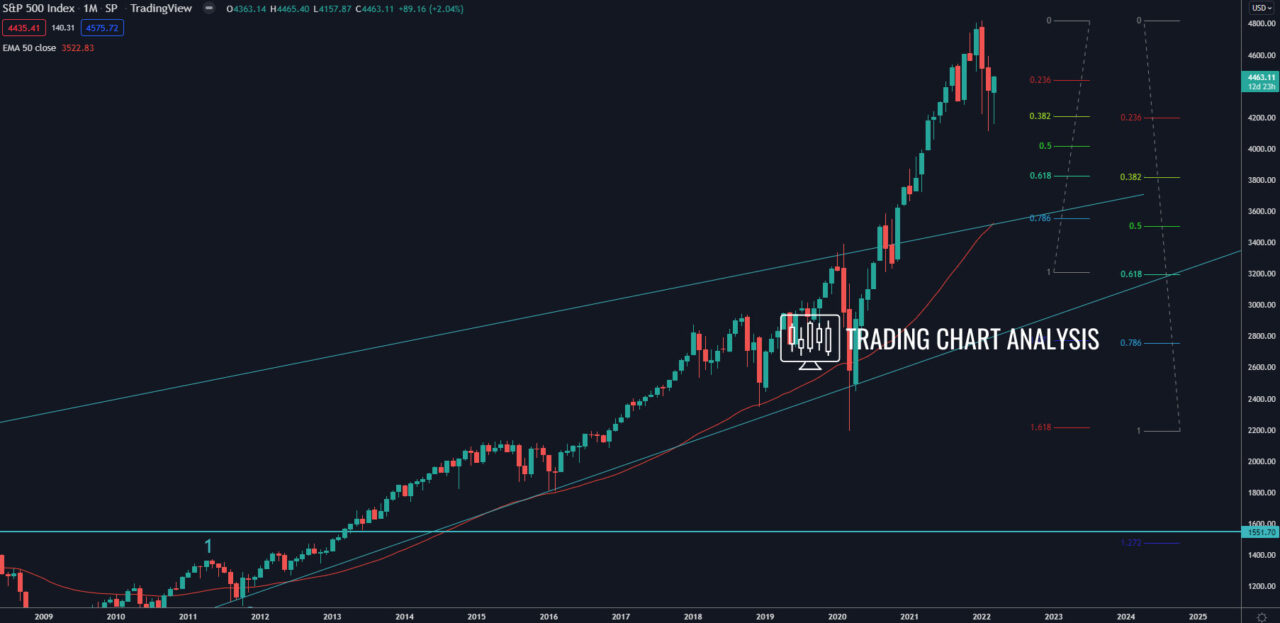
Technical analysis for S&P 500, the index formed a double bottom on the daily chart, holding the 0.618 FIB retracement on the weekly chart and 0.382 FIB retracement on the monthly chart. The index closed the week with a bullish engulfing pattern, breaking above the weekly 50 EMA, the daily 50 EMA, and above the high at 4416, starting a pullback. The first target of this pullback is the 0.618 FIB retracement around 4550. If the index S&P 500 breaks above the 0.618 FIB retracement on the daily chart and above the high at 4595, that will open the door for a bullish run toward the previous all-time high at 4818.
On the other hand, if the S&P 500 breaks below the weekly low at 4114, that will resume the bearish trend and send the index lower. The first target for this potential bearish breakout is the 0.618 FIB retracement on the monthly chart around 3825.
Daily chart:

Weekly chart:

Monthly chart:


