|
Getting your Trinity Audio player ready...
|
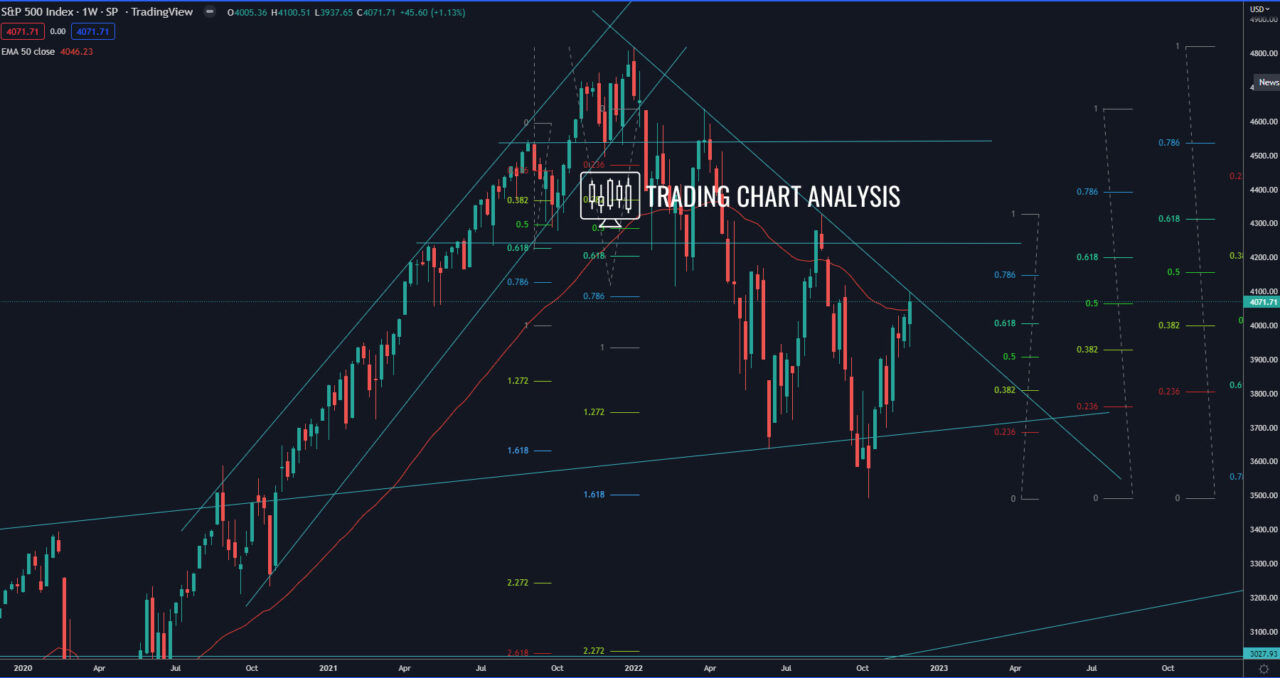
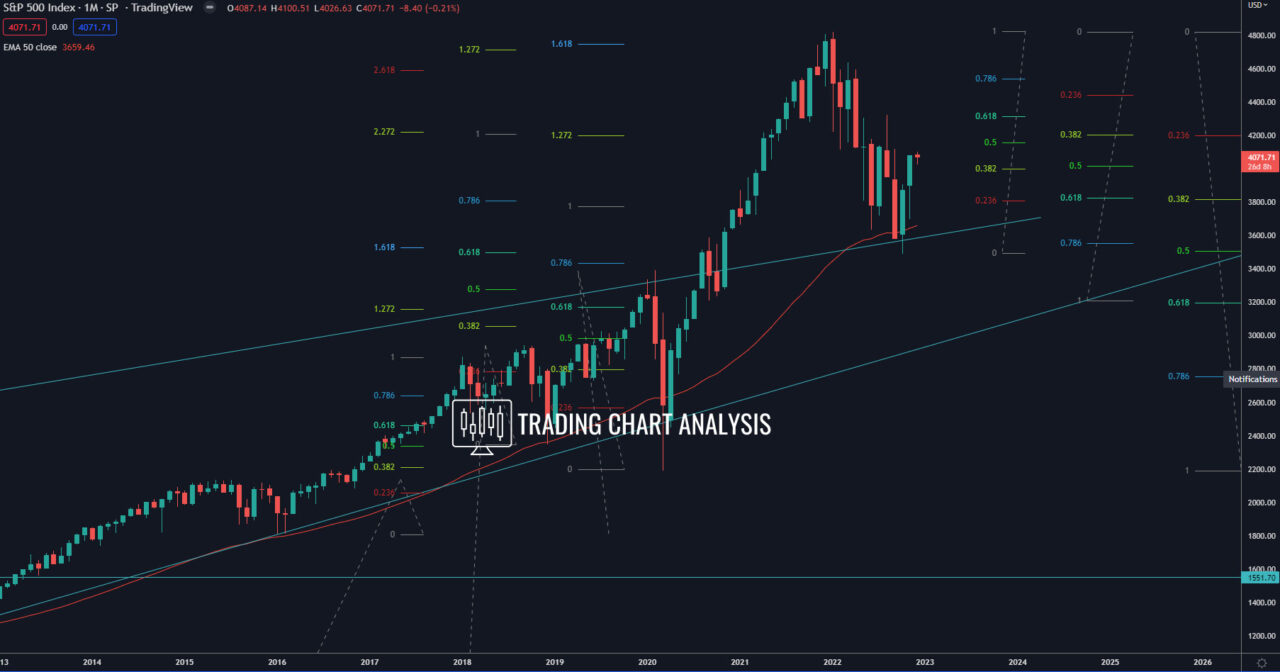
Technical analysis for S&P 500, the index reached a resistance zone a descending trend line on the weekly and the daily charts, and the weekly 50 EMA. A break above the descending trend and above 4100, will be a bullish signal and open the door for a bullish run toward the 0.618 FIB retracement on the monthly chart at 4325, which is the high from August 2022 for the S&P 500.
The zone between 4100 – 4325 will be closely watched by market participants for rejection and resumption of the bearish wave on the monthly chart for the S&P 500.
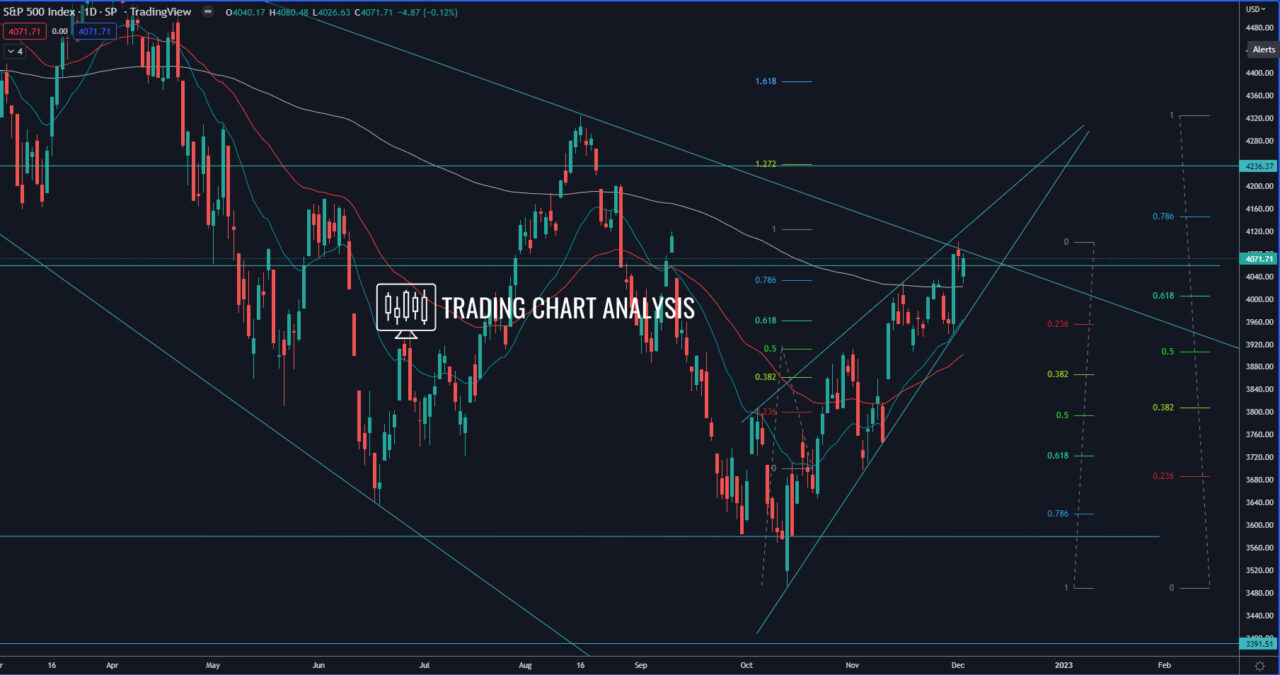
The focus is on the ascending wedge on the daily chart, a break below this pattern will signal a resumption of the bearish wave for the S&P 500. The first target for such a bearish development is the support and the daily 50 EMA at 3900. The second target is the 0.618 FIB retracement on the daily chart and support zone around 3720. The third target is the previous low on the weekly chart at 3491. And bearish break below the previous weekly chart at 3491, will send S&P 500 plunging toward the 0.618 FIB retracement on the monthly chart at 3200.
Daily chart:

Weekly chart:

Monthly chart:


