|
Getting your Trinity Audio player ready...
|
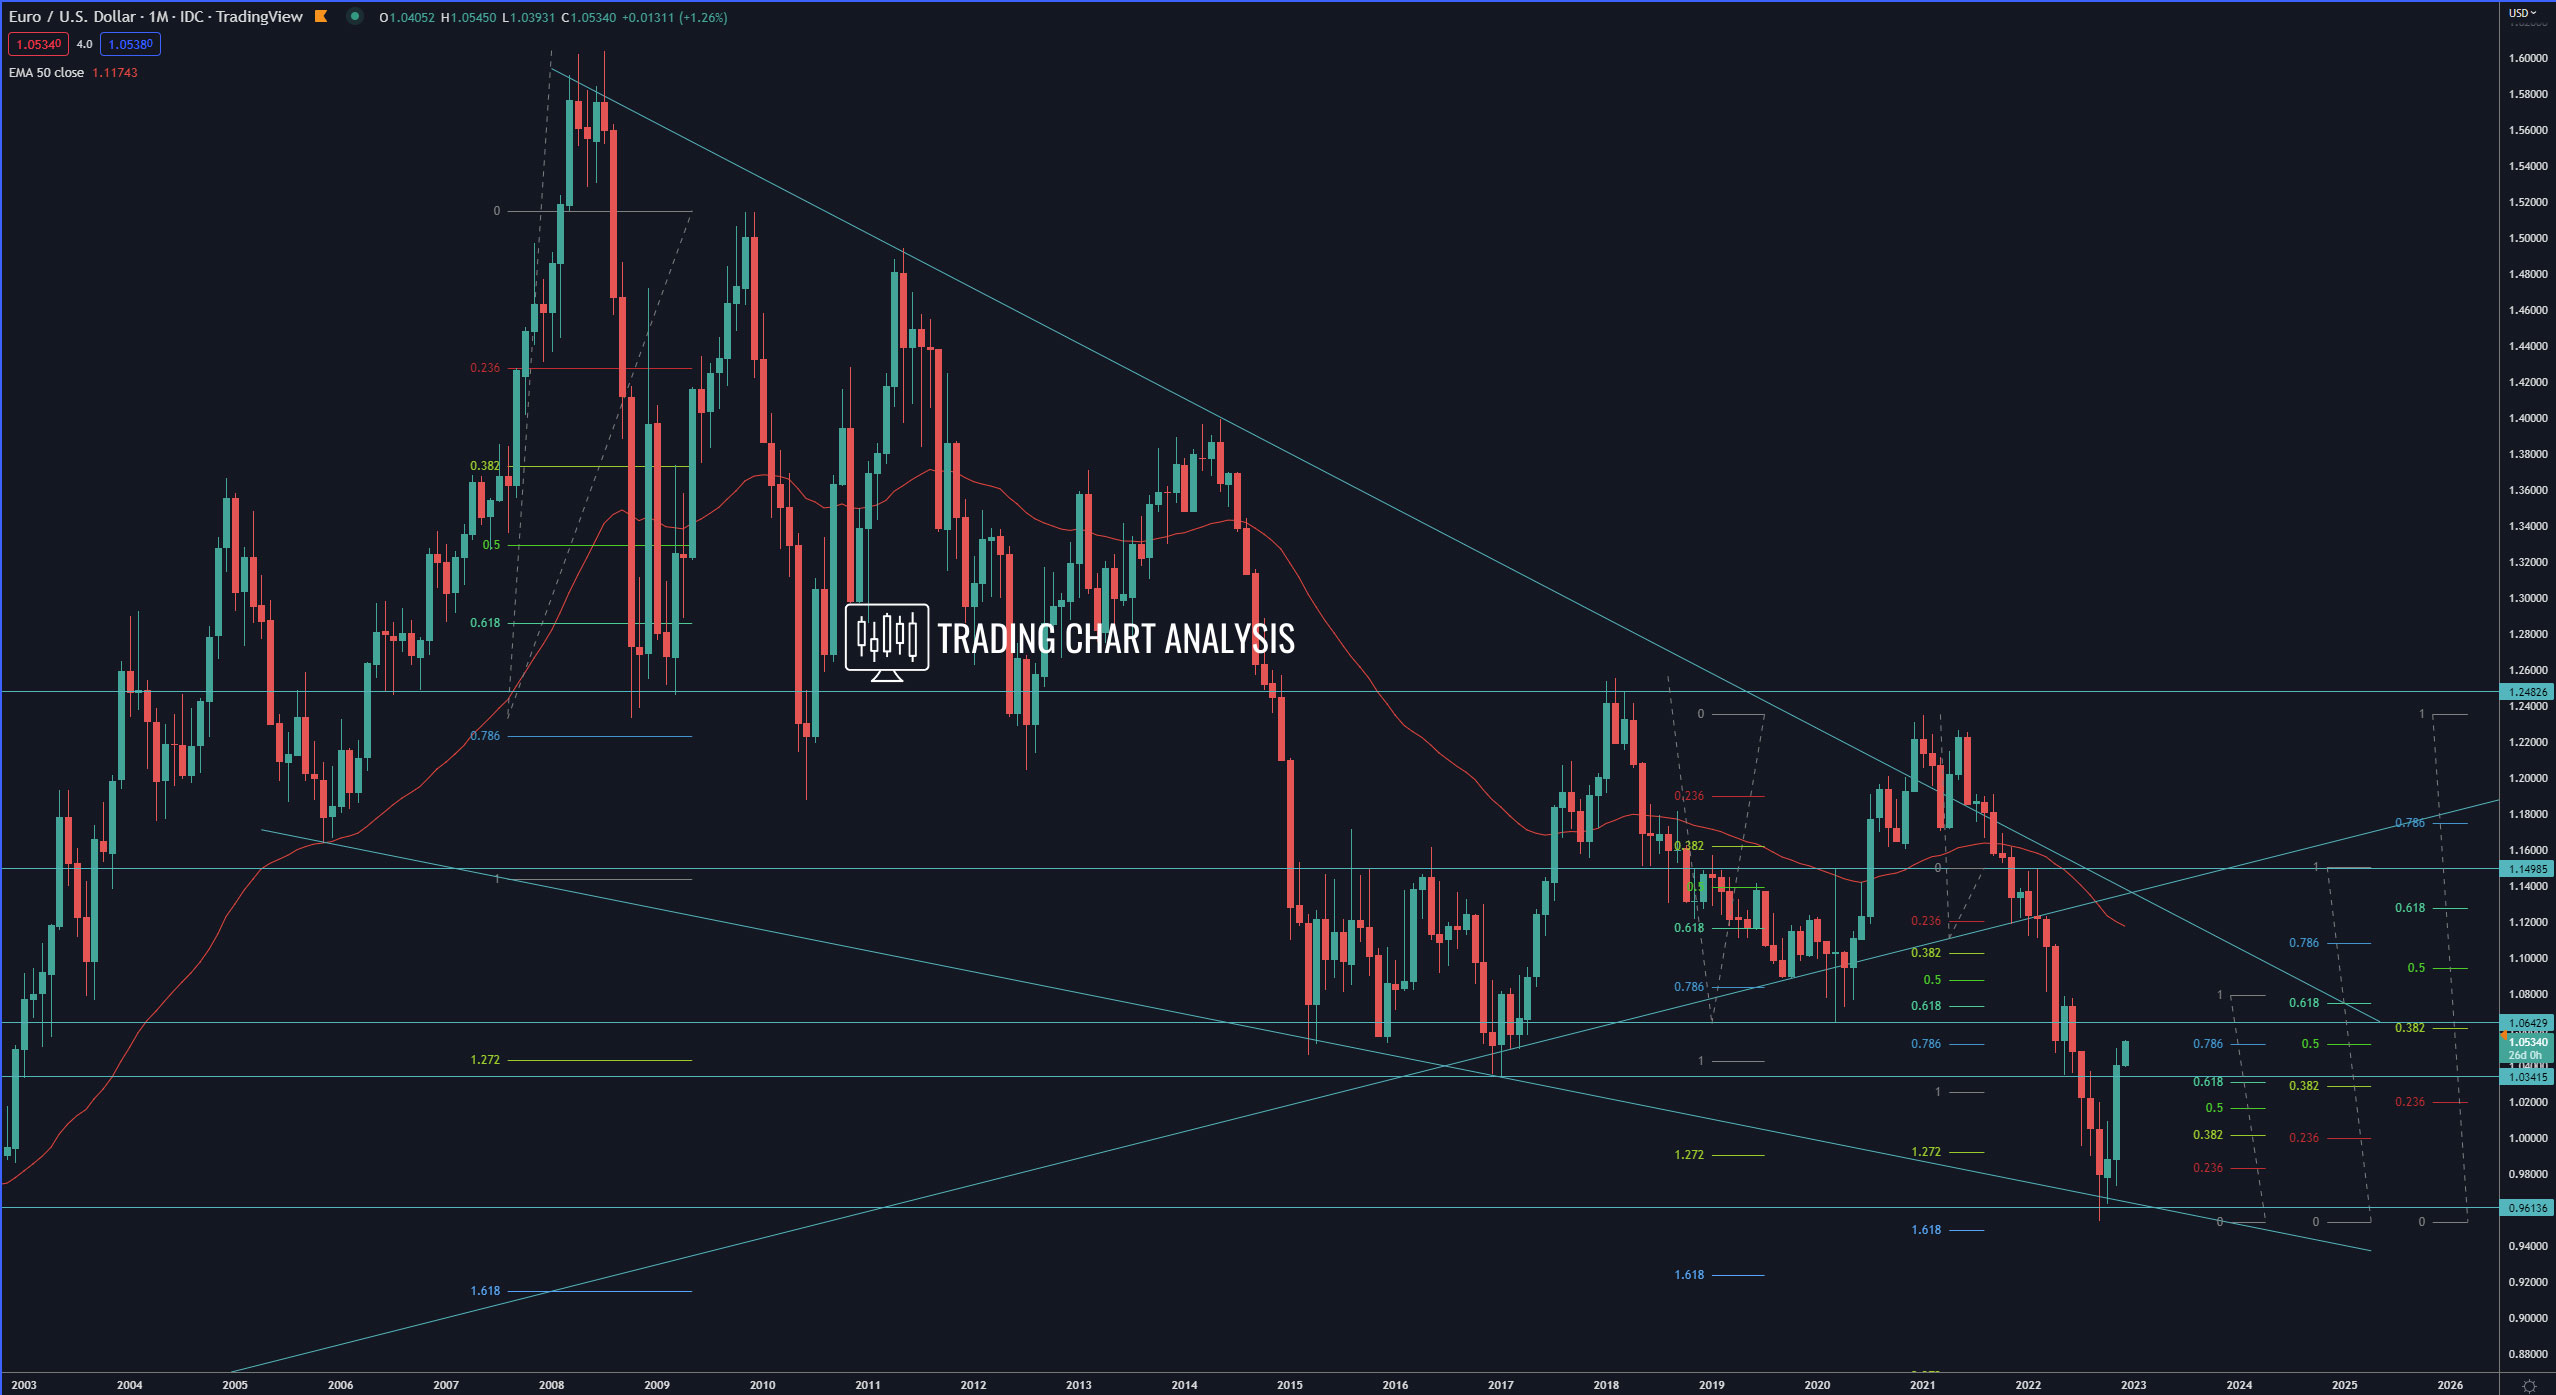
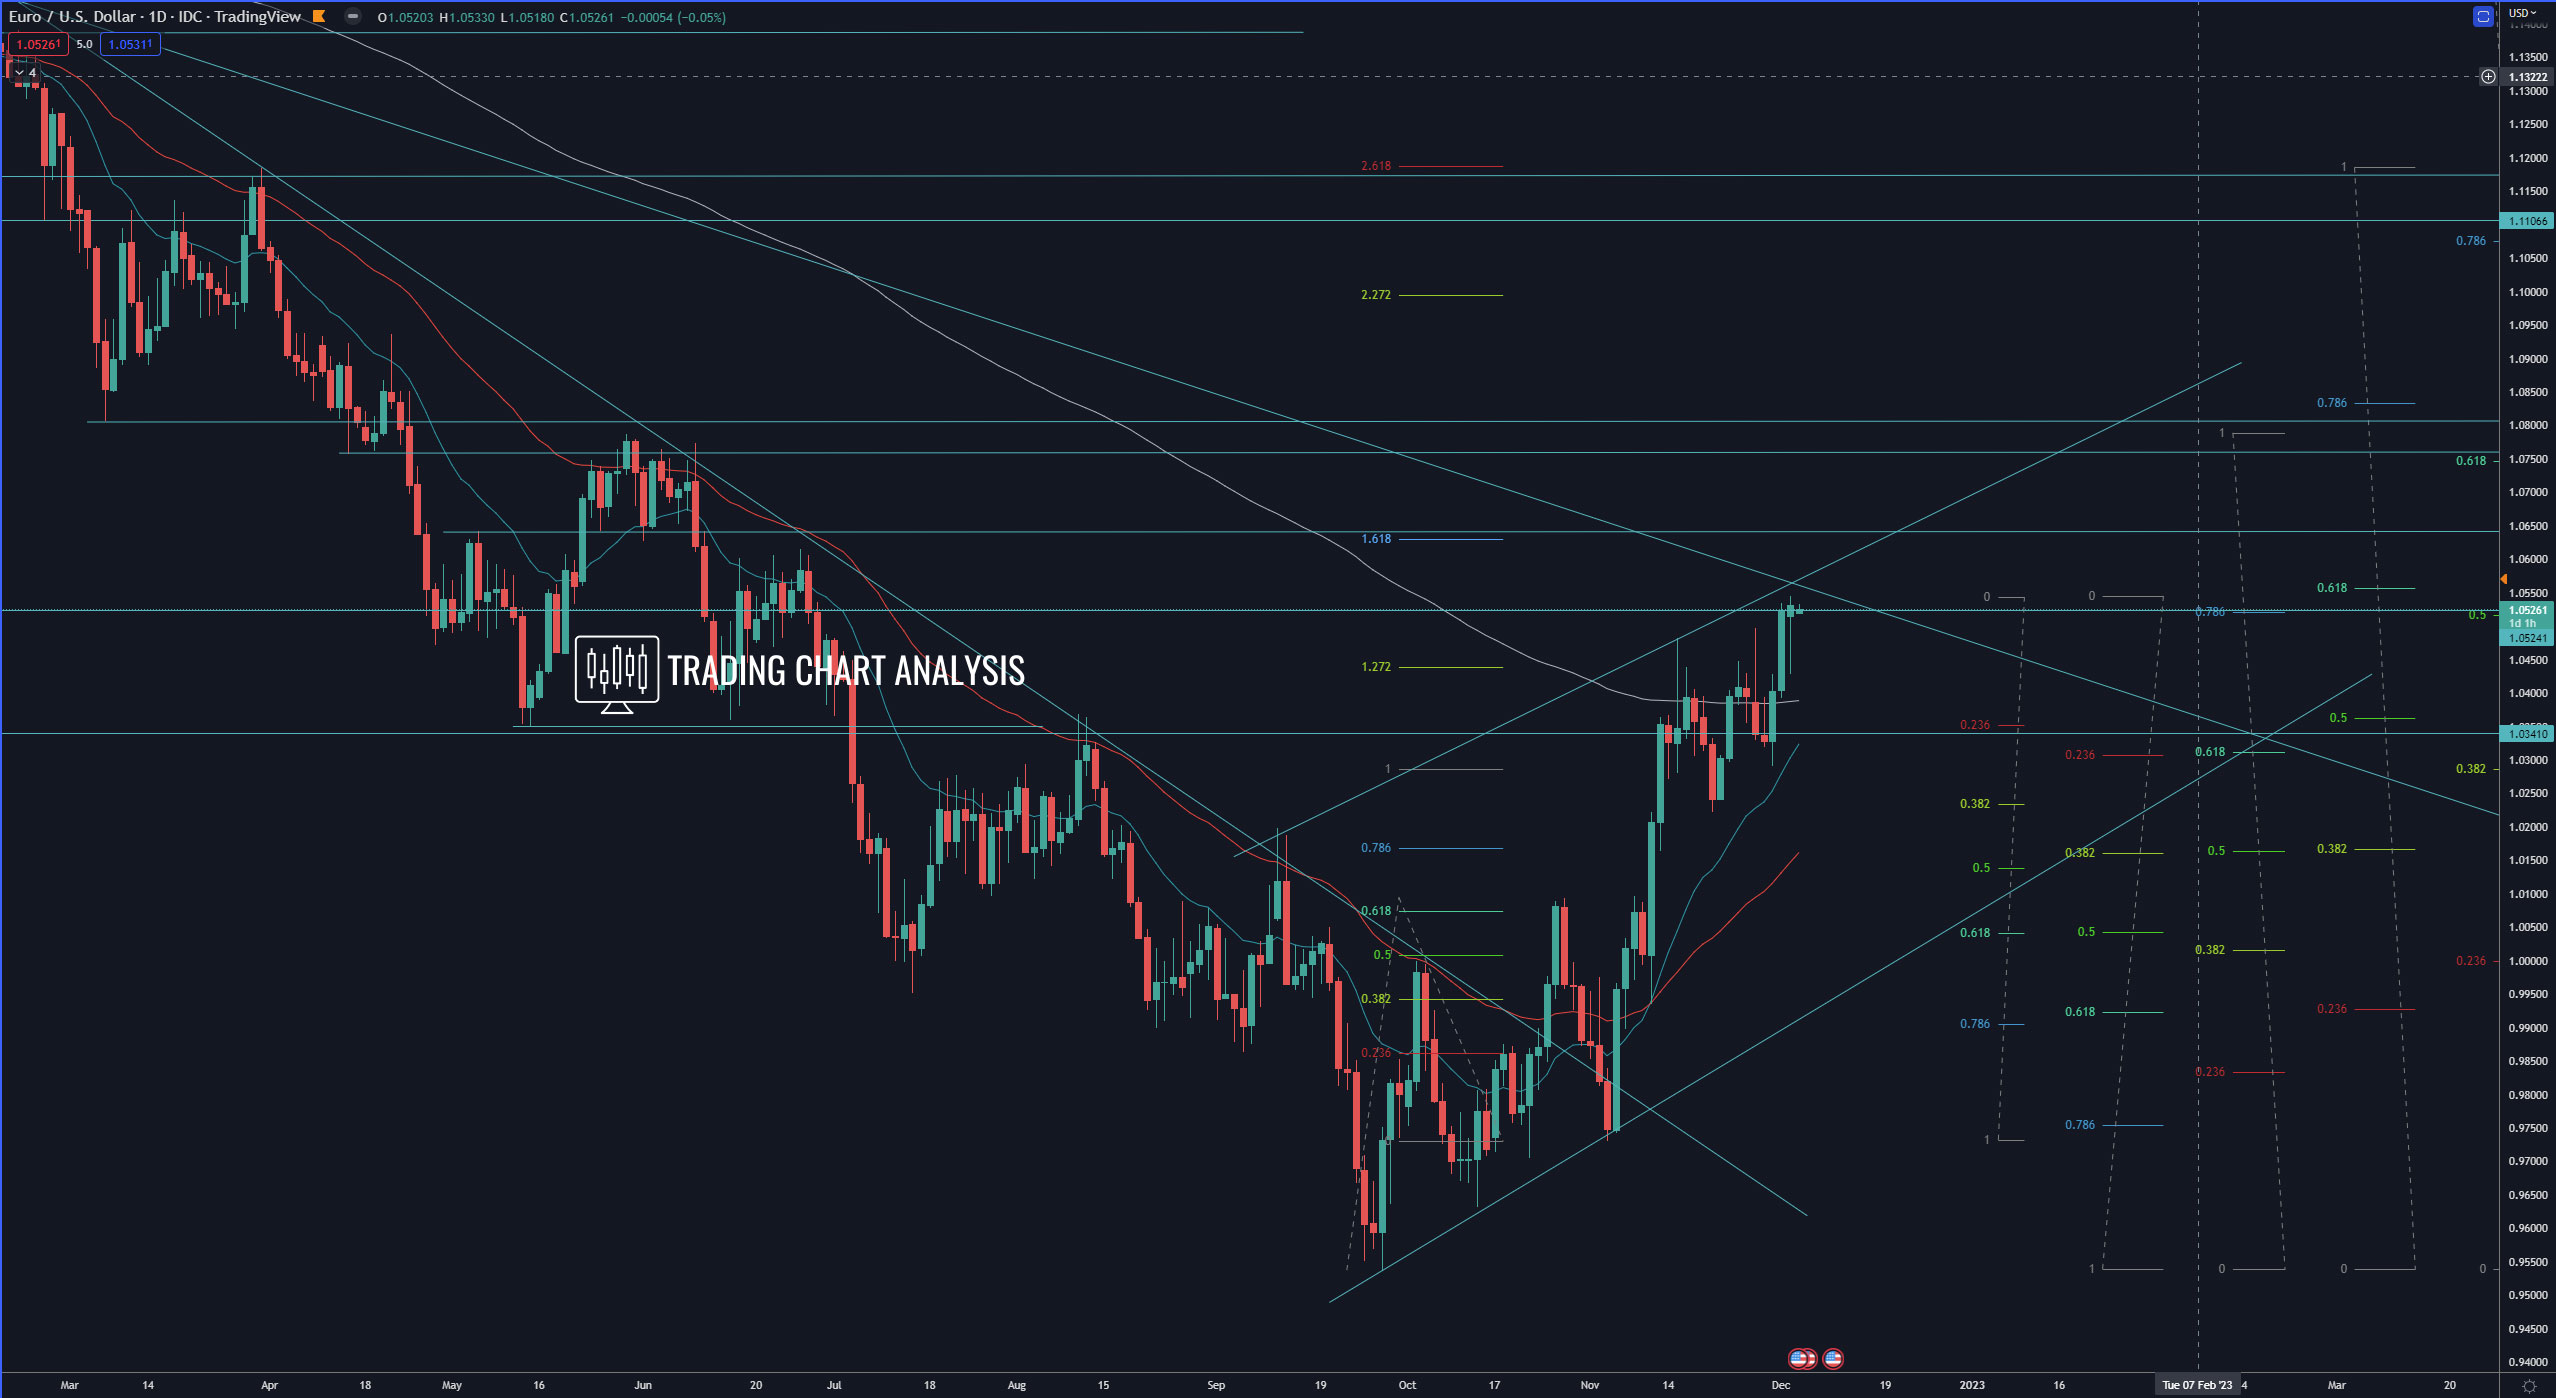
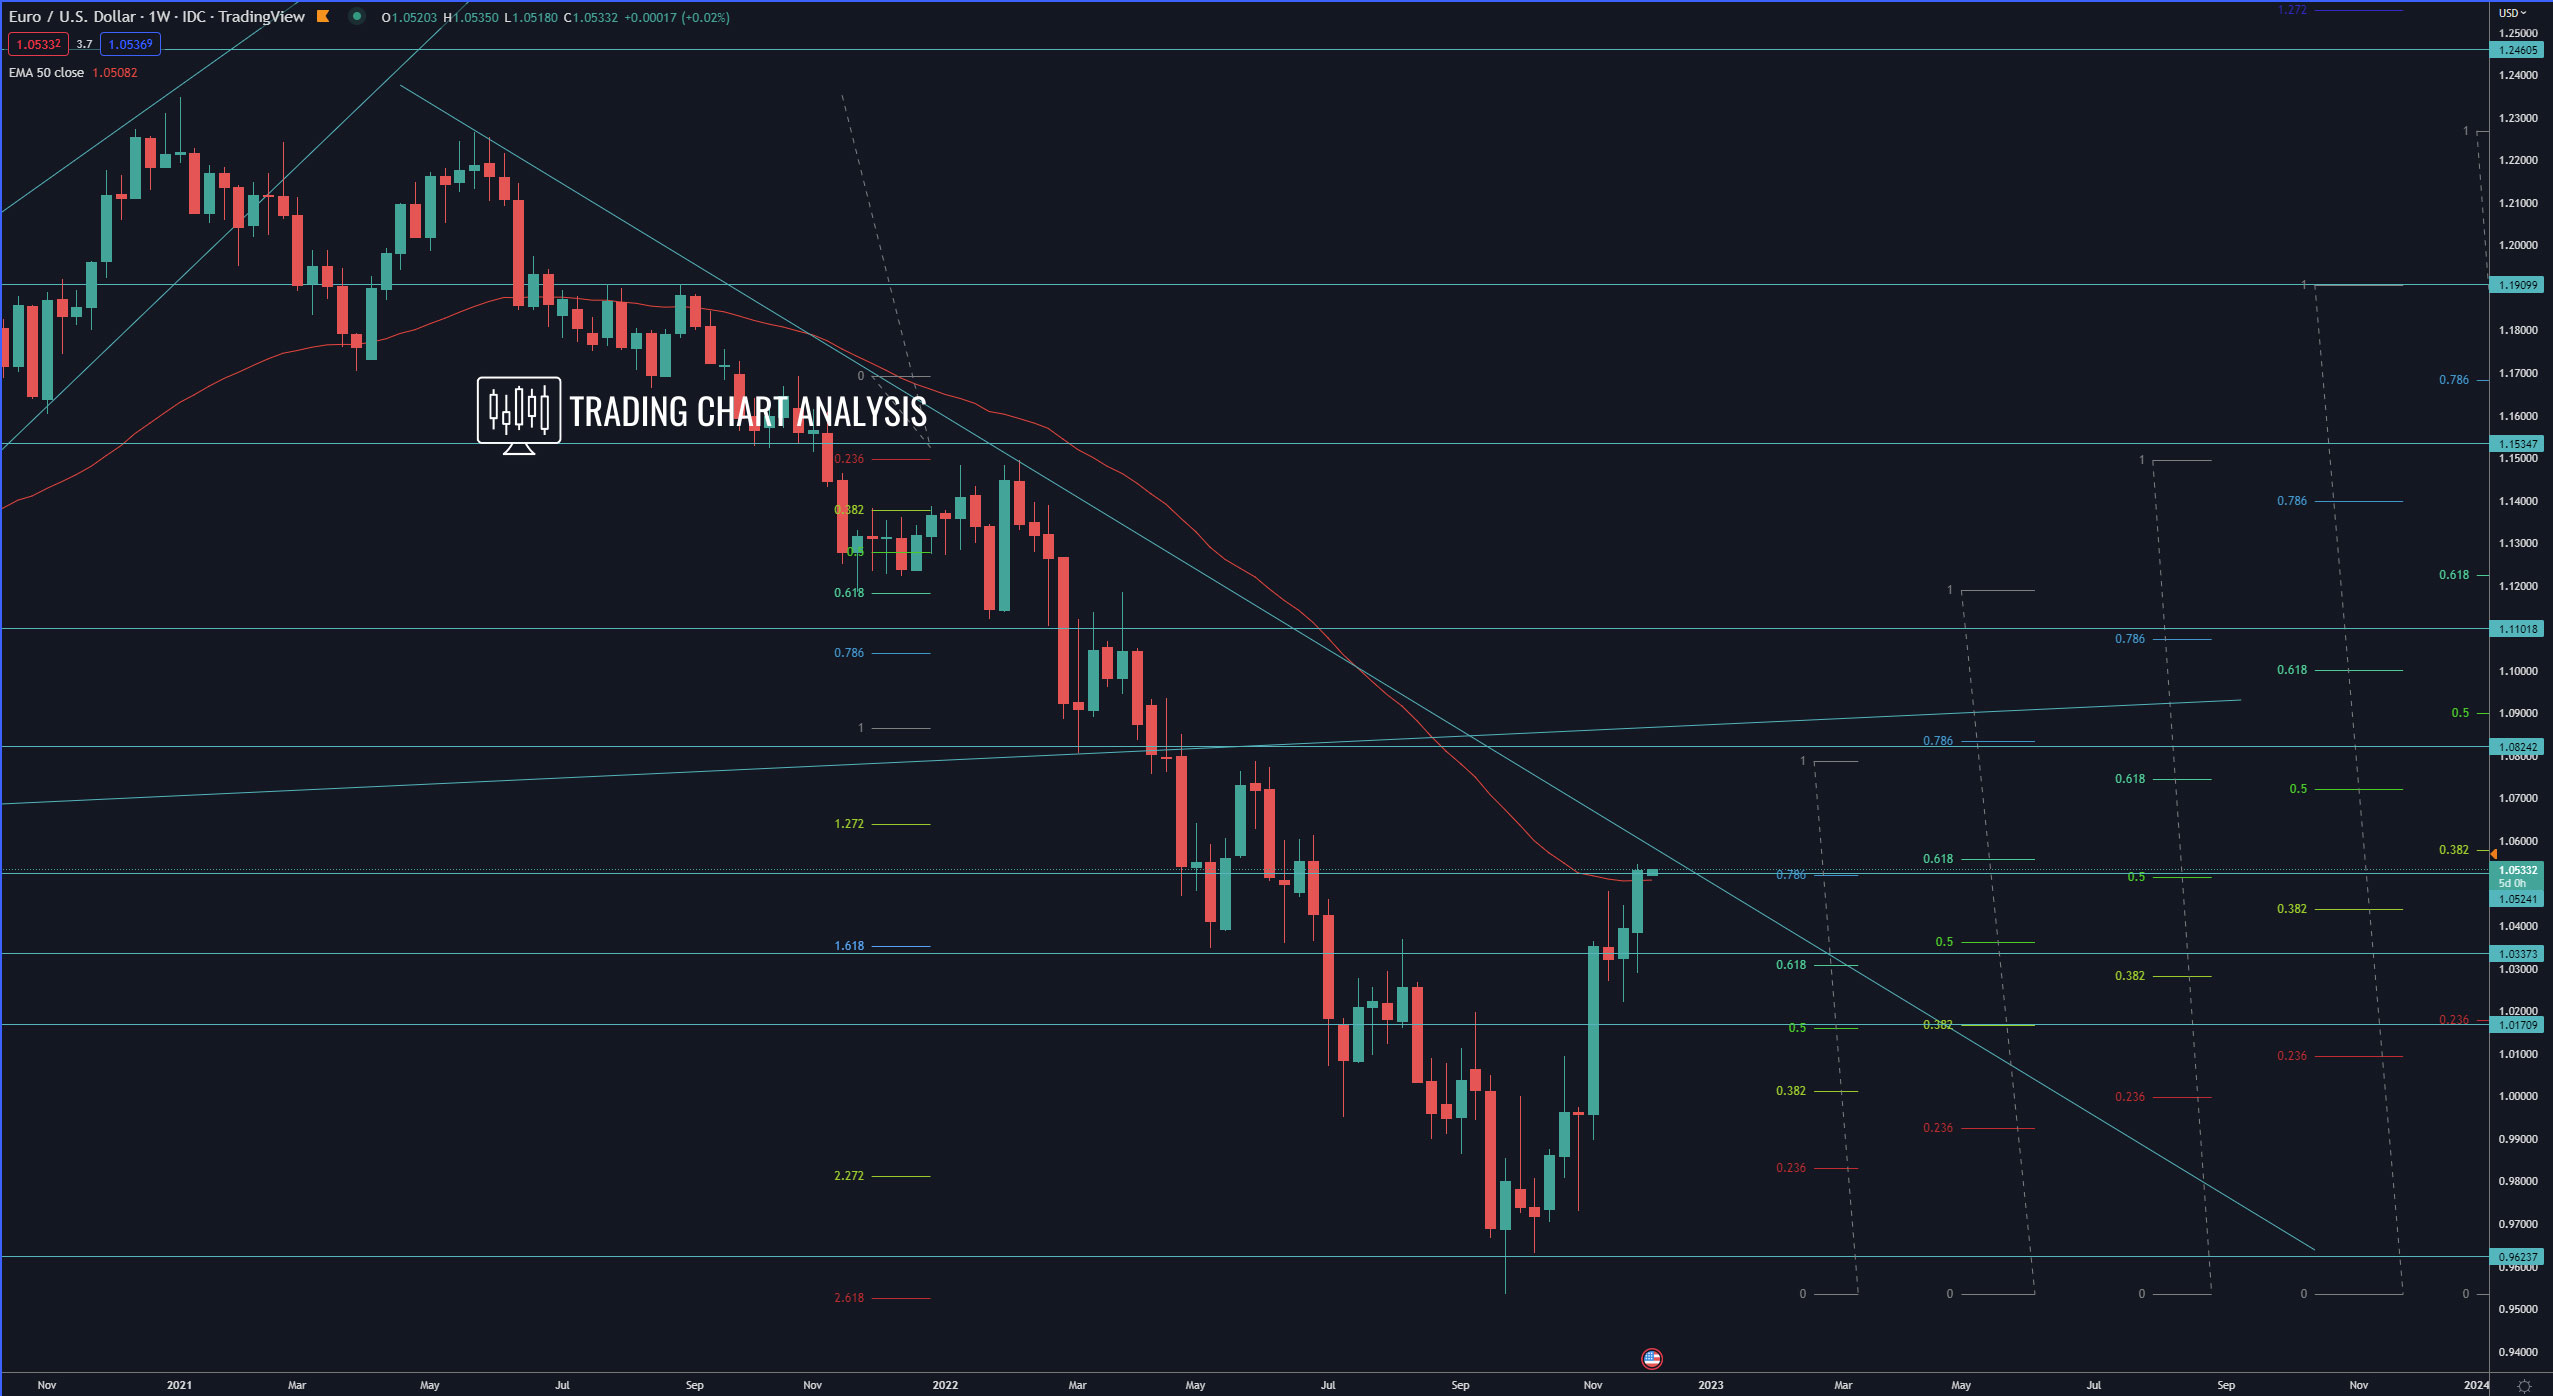
Technical analysis for the EUR/USD, the pair is facing a descending trend line, resistance zone, and the 50 EMA on the weekly chart. A break above this resistance zone between 1.0550-1.0625, where we have the 0.382 FIB retracement on the monthly chart, will send the EUR/USD higher. The first target for this potential bullish development is the resistance zone between 1.0725-1.0785. The second target is the 2.272 FIB extension on the daily chart at 1.1000. And the third target of this potential bullish run in the EUR/USD is the 2.618 FIB extension on the daily chart at 1.1285, where we have the 0.618 FIB retracement on the monthly chart.
On the other hand, a rejection of the descending trend line will start a pullback on both the daily and the weekly charts. The first target for this potential pullback in the EUR/USD is the 0.382 FIB retracement on the daily chart and previous low at 1.0230. The second target is the 0.618 FIB retracement at 1.0040, which is a 0.500 FIB retracement on the weekly chart.
Daily chart:
Weekly chart:
Monthly chart: