|
Getting your Trinity Audio player ready...
|
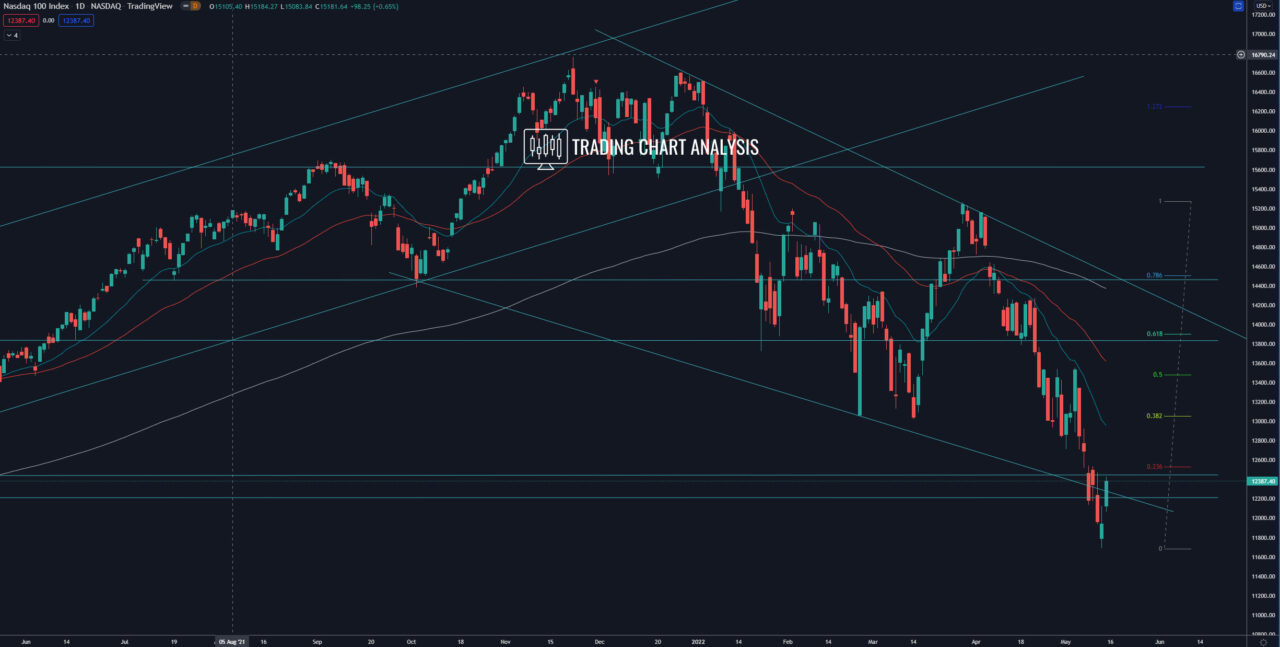
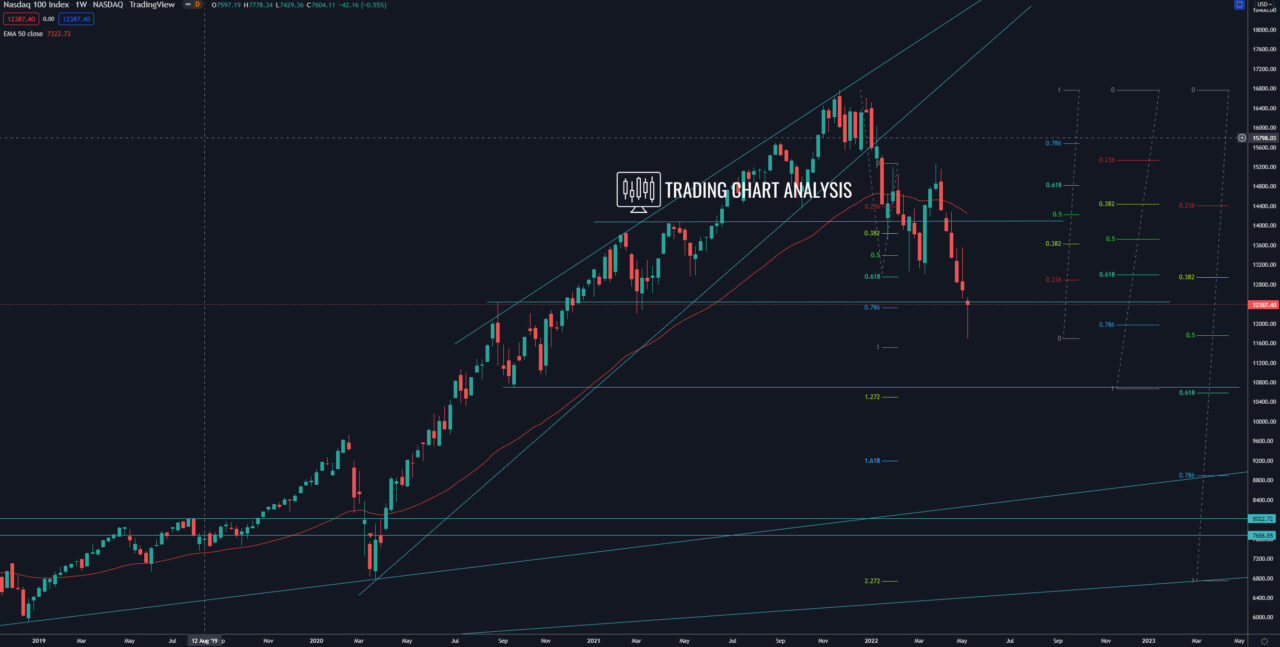
Technical analysis for NASDAQ, the index closed the week with a low-test candle on the weekly chart, bouncing from support, signaling a pullback. We must keep in mind that despite the strong rejection on the weekly chart, on the one-hour chart we don’t have a breakout yet, and we have a gap, which should be filled at some point. The first target for this pullback is the 0.382 FIB retracement on the daily chart at 13 050, where we have a resistance. The second target for the pullback in the NASDAQ index is the 0.382 FIB retracement on the weekly chart at 13 625. The third target is the 0.618 FIB retracement on the daily chart at 13 900, around the weekly 50 EMA. The fourth target for the pullback is the 0.618 FIB retracement on the weekly chart at 14 830.
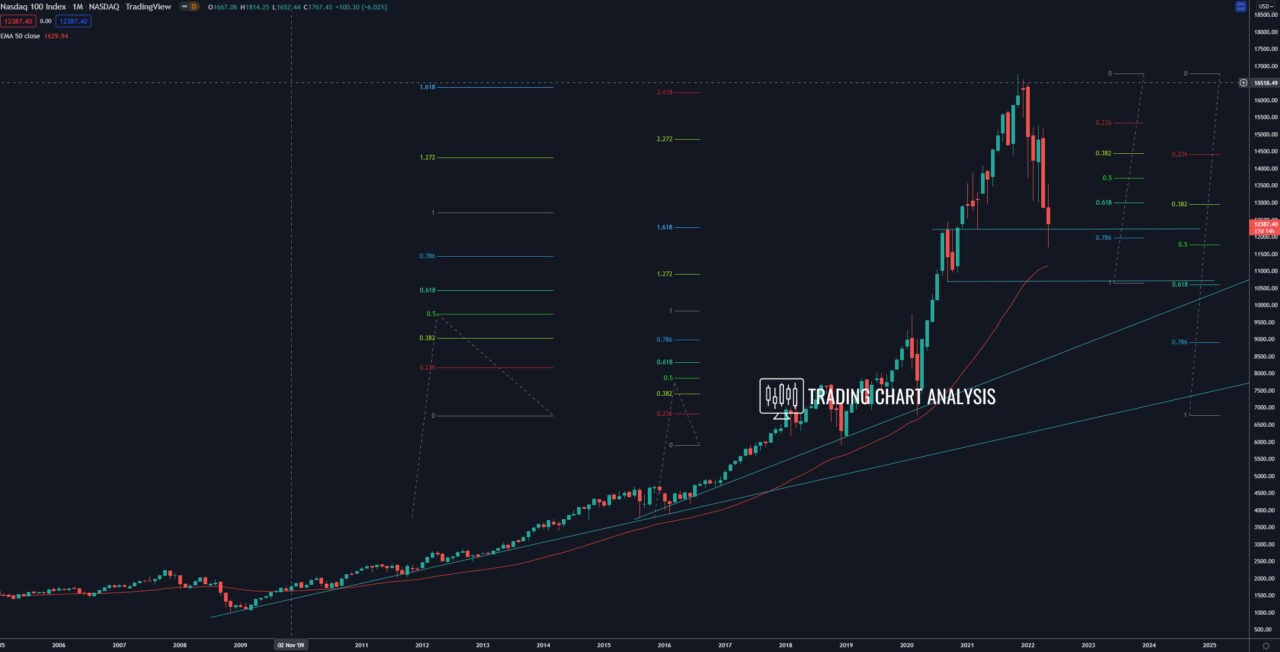
Looking at the bigger picture, NASDAQ closed below the 0.618 FIB retracement on the weekly chart, below the 0.382 FIB on the monthly chart at around 12 960, and below the double bottom on the daily chart at around 13 065. This breakout opened the door for a bearish run toward the 0.618 FIB retracement on the monthly chart at 10 600, just above the 1.272 FIB extension on the weekly chart at 10 500. The NASDAQ index is on its way toward that zone, which is a target for the bearish wave on the weekly chart.
Daily chart:

Weekly chart:

Monthly chart:


